Meet the Presenter
This article is based on a webinar presented by STLE Education on June 29, 2023. Going Under the Microscope: Fluid Testing, Analysis and Techniques is available at www.stle.org: $39 for STLE members, $59 for all others.
STLE member Brandon Van Horn, the data analysis manager with POLARIS Laboratories®, is the in-house subject matter expert in fluid power applications. He specializes in micropatch, ferrography and filter debris analysis methods. His career background is in automotive maintenance, and his educational background is in mechanical engineering. He has the STLE Certified Lubrication Specialist™ (CLS) and STLE Certified Oil Monitoring Analyst™ (OMA) certifications, and he is chair of STLE’s OMA Committee. You can reach Van Horn at bvanhorn@polarislabs.com.

Brandon Van Horn
KEY CONCEPTS
•
Microscopic analysis can help to identify contaminants and wear metals, trace their sources and assess the severity of the problem.
•
Microscopic techniques are easy to perform and relatively inexpensive and can be used to supplement or verify the results of more routine laboratory tests.
•
Detailed information from the customer and consistent, well-documented lab reports guide recommendations for continued monitoring and corrective actions.
Regular testing and analysis help to assess the condition and performance of fluids—including lubricating oils, hydraulic fluids, coolants and fuel—as they circulate through machinery and equipment. This assessment, in turn, can alert workers to potential issues before they cause costly equipment failures or downtime.
After performing routine lubricant analysis, advanced test methods including microscopic analysis may be recommended to further identify the root causes of problems. Microscopic analysis can identify contaminants and wear metals, and it provides information on the size and characteristics of these particles to help determine their causes.
Here, we discuss the fundamentals of microscopic analysis, the techniques used, tests performed and how results are interpreted and used to plan maintenance actions.
This article is based on an STLE webinar titled Going Under the Microscope: Fluid Testing, Analysis and Techniques presented by STLE member Brandon Van Horn, the data analysis manager with POLARIS Laboratories®. See Meet the Presenter for more information.
Quality input generates actionable output
Regular oil analysis is key to running a successful oil reliability maintenance program. Administering this type of program requires several simple but critical steps. Placing orders for the right types of test kits and ensuring that samples are submitted to the lab with complete, correct paperwork helps ensure that lab results are relevant and actionable.
If the lab analysts have detailed information on the type of mechanical equipment, the application and the operating environment involved, they can provide the customer with a more detailed interpretation of the analysis and more relevant advice on steps to remedy any problems they observe. Customer consultations with lab personnel before ordering tests can help to ensure that the right tests are performed, and the analysts can look for the most relevant characteristics of the sample and provide better recommendations
(see The Importance of Good Input).
The importance of good input
One customer who requested routine fluid testing provided no information on the source of the fluid sample, other than that it came from a refrigeration compressor. The sample contained a high amount of copper, but no other wear metals. The analyst noted that the copper could be coming from bushing wear, or it could have leached from lubricant or coolant tubing. The leaching effect is generally harmless, but the lab recommended a micropatch test to check for wear particles. Further discussions with the customer indicated that they were using a polyester oil. Because ester-based oils and water-based lubricants can dissolve the lab’s standard patch material, the lab recommended a photographic method that does not involve the use of filtration or patch analysis using an alternative patch material (e.g., PTFE).
Lab reports should contain a severity factor scale and information organized in a consistent manner. Photomicrographs of the particulate deposits should visually reinforce the conclusions reached during the analysis. Reports should provide a table that clearly characterizes the deposits observed on the microscope slide, with information on particle size ranges, appearance and amounts. Observations and recommendations should be provided using consistent terminology, which helps to provide objective interpretations and recommendations, regardless of which analyst worked on the samples.
Adding microscopy to the toolbox
Microscopic techniques, which are easy to perform and relatively inexpensive, are often used to supplement or verify the results of more routine laboratory tests or to provide information necessary to address a mechanical problem. Microscopic analysis is especially useful for critical operations or equipment, where the costs of downtime or repairs, or the hazards to worker safety or the environment, are especially high.
Routine oil analysis programs can bring attention to an abnormal wear trend, but more information may be needed to assess the severity of the problem. Additional tests may be required, including membrane patch colorimetry, filter debris analysis, ultrasonic testing, thermography or mechanical vibration measurements. These methods may be used alone or in conjunction with each other.
Even under normal operating conditions, industry standards or OEM specifications may require or recommend additional testing. The experiences of other customers running similar operations can be a useful source of information, but comparing samples between customers is not trivial because of the large number of variables involved.
Microscopic analysis can provide information that is not easily accessible using other methods. For example, filter debris analysis can prove useful in situations where taking representative samples is difficult (e.g., from inoperable equipment). Microscopic methods are also valuable in situations where there is a suspected mechanical fault or contamination in the system. The results can indicate the severity of the problem and point toward the root cause.
Microscopic methods (often in conjunction with other methods) can help to confirm whether heavy thermal discoloration on wear deposits is caused by excessive heat during operation, and they can point to possible causes of the heat buildup. Such causes include lubricant starvation at the interface, excessive operating speeds or a lubricant with a viscosity that is too high for the application. Intermittent decreases or complete washout of a lubricant film can also cause excessive boundary contact between interacting surfaces. Excessive moisture or fuel contamination, which can decrease lubricant film strength, can also cause heat buildup. However, microscope analysis cannot directly identify these contaminants, and other test methods may be required. Heat buildup can also be the result of mixing two incompatible oils, resulting in additives coming out of solution.
Microscopic analysis does not provide information on how long a piece of equipment can continue to run, an explicit identification of which internal component is the source of the wear particles or suggestions on what can be done in the interim. Microscopy provides information as to the identity of various wear metals, but it does not give exact identification of contaminants. Methods like scanning electron microscopy–energy dispersive X-ray spectroscopy (SEM-EDS) or X-ray fluorescence (XRF) can identify the chemical elements present in contaminants, but these techniques must be calibrated against known materials. Other methods may be required to identify how contaminants entered a system or provide information on how to keep contamination out of the system (see Supporting Tests).
Supporting tests
Several types of testing can support the results of a microscopic analysis, if further clarification or confirmation is required. Scanning electron microscopy (SEM) provides images at a greater magnification than is possible using an optical microscope, and an energy dispersive X-ray spectroscopy (EDS) detector can be added for elemental analysis. Elemental metals testing using flame techniques like atomic emission or absorption spectroscopy, analysis of particles digested in acid using inductively coupled plasma (ICP) or X-ray fluorescence (XRF), or rotating disc optical emission spectroscopy provide elemental “fingerprints” of the metals in a sample.
Other laboratory tests include:
•
particle quantifier ferrous density
•
particle count
•
viscosity
•
Fourier transform infrared (FTIR) spectroscopy
•
moisture content (Karl Fischer method, hotplate estimate, etc.)
Machine component tests
in situ:
•
ultrasound
•
thermography
•
vibration
Multiple unknown factors can complicate particle identification using microscopic analysis. The laboratory can generate a more detailed report if they know what lubricant was in use, whether operations and loads are continuous or intermittent, whether filters are being used in the lubricant circuit and whether the system is performing one operation or more than one.
Microscopy methods
The two main methods of microscopic fluid analysis are analytical ferrography and micropatch analysis. Analytical ferrography is best for investigating ferrous debris—iron-containing particles from steel mechanical components, contaminants entering the system or other sources
(see Figure 1). This method is also useful for detecting sub-micron debris that often eludes filter-based methods. Analytical ferrography relies on gravity and the magnetism of the deposits. Although nonferrous materials interfere less with the results than for some other methods, these materials may also elude detection.
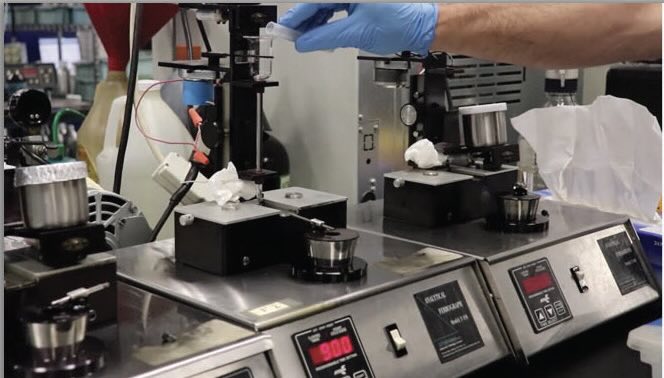 Figure 1. Analytical ferrography lab setup. Figure courtesy of POLARIS Laboratories®.
The standard method used, ASTM D7690, involves passing the sample through a thistle tube and dripping a small part of the sample onto a microscope slide that sits on top of a magnetic plate. The magnetic plate attracts and holds the ferrous particles, and the slide is rinsed with heptane or isopropyl alcohol (IPA) to remove the oil, leaving only the solid deposits on the slide. One advantage to this method is that dark nonferrous particles like engine soot wash off of the slide, unlike patch methods where these particles collect on the patch along with all the other particles. Placing the magnetic plate toward one end of the slide sorts the ferrous and nonferrous particles to aid in distinguishing abnormal wear particles from ferrous and non-ferrous alloys. The slide is examined under a microscope to identify the particles.
Micropatch analysis is useful for nonferrous debris, debris with low amounts of ferrous materials, or minimal total amounts of debris. ASTM D7684 is a standard method for patch analysis, or an in-house method may be used. A fine-filter membrane patch is clamped between two plates at the bottom of a graduated funnel placed above a drain flask
(see Figure 2). A measured amount of sample is poured into the funnel, and a vacuum is applied to the drain flask. The solid deposits collect onto the patch, which is then dried before examining it under the microscope.
 Figure 2. Micropatch analysis lab setup. Figure courtesy of POLARIS Laboratories®.
This method is efficient at catching all insoluble contamination, but the size range of particles detected relies on the pore size of the patch, and contaminants can deposit unpredictably. Thicker lubricants may have difficulty passing through the patch, and samples with heavy contamination may clog the pores in the patch. Diluting thick samples with select solvents can reduce their viscosity and aid in testing. Also, it’s important to remember that the amounts and identities of particles observed on the patch might not be the same as the particles in the entire sample—or in the system that the sample was taken from.
Contaminant particles
Lubricant contaminants come in various shapes, sizes and colors. Most systems do not require zero contamination; rather, they have a recommended tolerance range where a good lubricant film strength can compensate for a limited amount of contamination. Contaminants from the surrounding environment may chemically react with a lubricant’s base stock or additives. For example, a newly added mechanical replacement part—or reassembling in-service parts—can introduce corrosion inhibitors that were used to protect these parts during storage but are incompatible with the lubricant formulation.
Dirt particles, which are often abrasive aluminosilicate minerals, are very common. These can appear transparent and crystalline on a microscope slide
(see Figure 3a). Dirt can cause abrasive wear, but not always, and particles caught on a filter may not be representative of what is circulating throughout the system. Larger particles (greater than the filter pore size) can be acceptable. However, large amounts of abrasive particles may be an indication that an air intake or breather is admitting excessive contamination, which can result in a need to change filters more often.
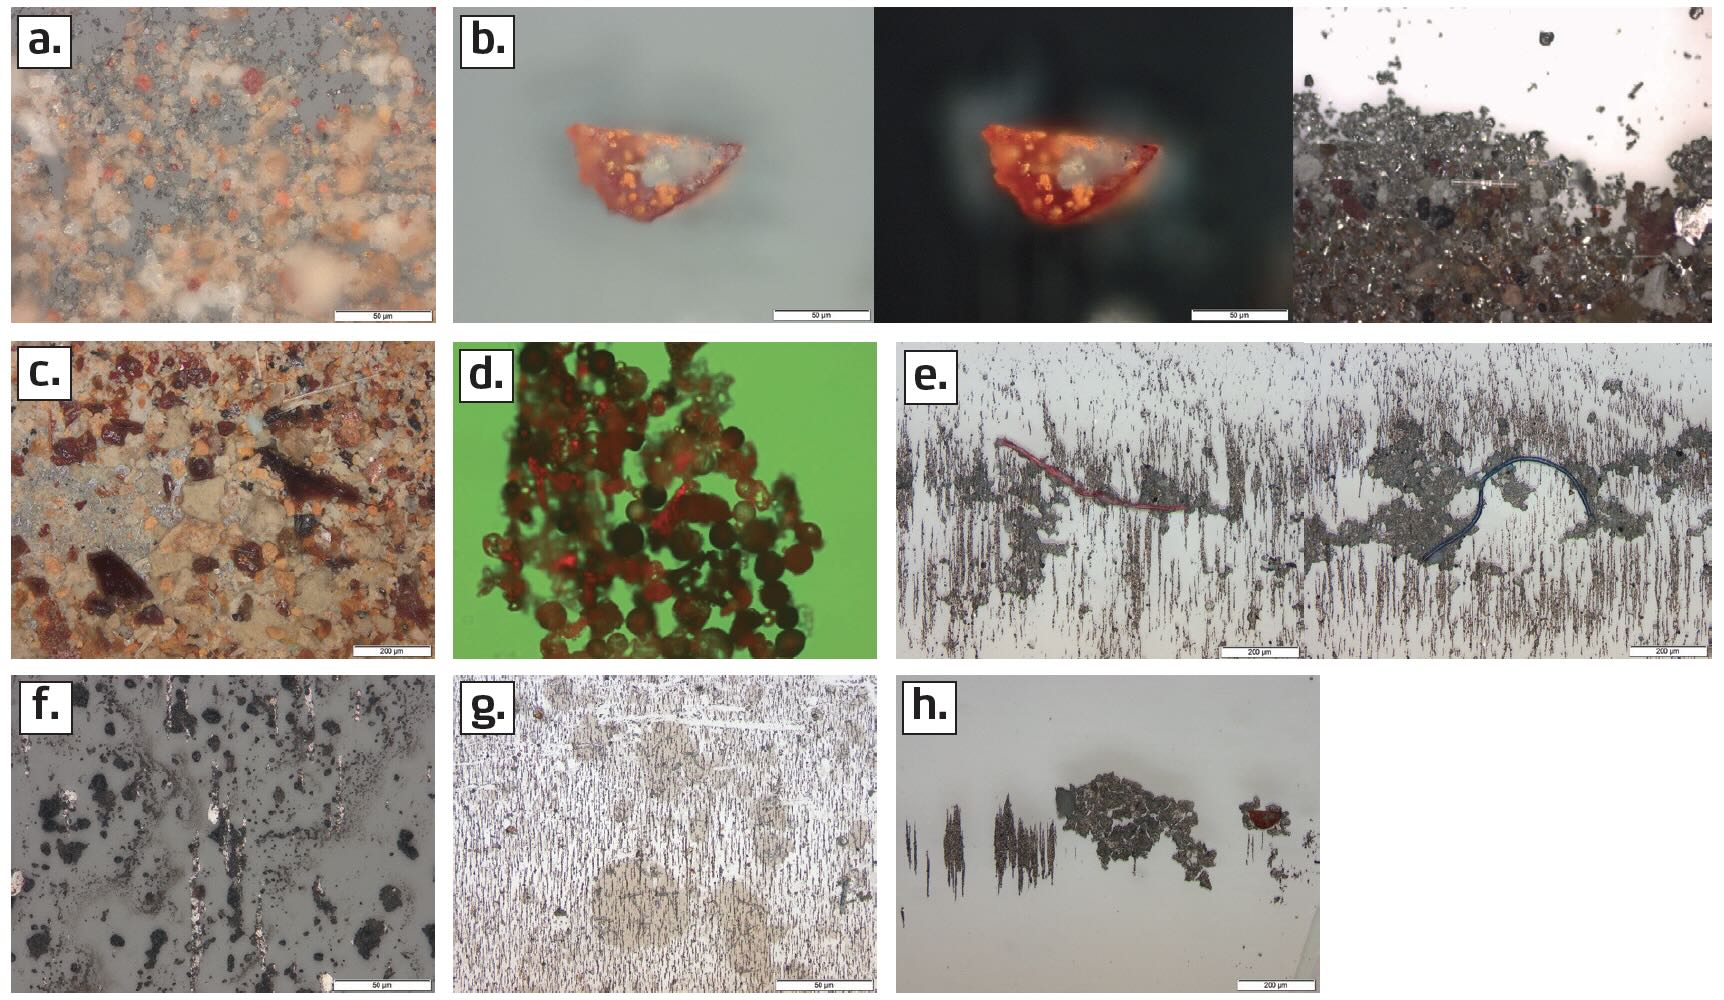 Figure 3. Types of contaminant particles, as seen under the microscope: (a) abrasives, (b) red and black oxides, (c) varnish, (d) nonmetallic spheres, (e) fibers, (f) soot, (g) grease and (h) friction polymers. Figure courtesy of POLARIS Laboratories®.
Red or black oxide particles show up under direct illumination, and a polarized filter can show the color better
(see Figure 3b). Black oxides can indicate discoloration of the wear particles caused by high temperatures. Red oxides (rust) are produced catalytically from contamination by water or other oxidizing species in the environment, and they can indicate headspace rusting or water leaks.
Varnish is a sticky polymeric material formed as a byproduct of lubricant degradation
(see Figure 3c). Varnish potential tests, which detect the chemical conditions that commonly precede varnish formation, are mainly performed for in-service turbines, but they can be performed for other applications as well. Membrane patch colorimetry is a relatively simple test to assess the degree of lubricant degradation, which can be a sign of excessive heat or other problems.
Nonmetallic spheres can indicate severe varnish formation
(see Figure 3d). They can appear transparent or opaque, and colored backlighting can help to distinguish between these types. They are usually observed along with platy varnish agglomerations. Nonmetallic spheres can also be precipitates that form when incompatible oils mix or when incompatible additives are present. They can indicate environmental contamination or contamination from corrosion protection coatings that were not fully removed when a piece of equipment was taken out of storage and added to the system. Nonmetallic spheres usually cover a micropatch, and they adhere to everything. Large amounts of these particles can restrict lubricant flow and prematurely load the filters in the system.
It can be difficult to determine the source of fibers observed under the microscope
(see Figure 3e). Cellulose and fibers can come from cotton or nylon rags or from fiber seals and bushings. They can also be a sign of filter collapse or a result of backflushing the system.
Soot is a combustion product from normal operations of internal combustion or diesel engines, but it is not normally present in high amounts
(see Figure 3f). Soot-like particles from non-engine applications might come from other sources, or they might be black oxides, so identifying them requires knowing what is more likely for a specific application. Heavy soot that does not wash off of the microscope slide may be a cause for concern. Heavy soot will bury wear and other contaminant particles on a micropatch, making determination of deposit frequency ineffective. Following up with other tests (e.g., Fourier transform infrared [FTIR] spectroscopy) is recommended. Micropatch analysis is not recommended for diesel engine equipment with non-applicable emission standards.
Elemental analysis showing an unusual amount of lithium may indicate that grease has contaminated the oil sample because few, if any, engine oils use lithium-containing additives. Likewise, elevated calcium, sodium or potassium levels can indicate grease contamination. Grease shows up as discolored patches when a sample is examined under a microscope
(see Figure 3g). The amount of the contamination indicates whether the problem is serious enough to warrant remedial action.
Friction polymers appear similar to grease under the microscope
(see Figure 3h). However, the elemental analysis results will be different, and large friction polymer particles can crack as the sample on the microscope slide dries. Friction polymers form when a lubricant is stressed, and they usually indicate that the lubricant is degrading. Friction polymers observed along with a decrease in lubricant viscosity indicate that the lubricant is shear thinning. Agglomerations of friction polymers are insoluble in most solvents used to dilute samples for testing. Significant amounts of friction polymers are often observed along with varnish wear or external contaminants.
Wear particles
Wear particles are produced from within the system, with or without external contaminants. Particle morphology can provide valuable information about the wear mode that produced particles in a sample, and their colors and other features provide clues as to their composition.
The most common wear mode is rubbing wear from the normal contact of interacting surfaces, producing wear particles typically in the 1- to 15-micron size range. Rubbing wear occurs for every type of equipment and operation, and it is caused by boundary lubrication conditions at startup. Rubbing wear deposits typically appear as high-abundance lines running along the long direction of the microscope slide
(see Figure 4a). Abnormal wear can be caused by extended drain intervals or abnormal wear modes, which also produce randomly oriented deposits of larger wear particles (although these may become pulverized during circulation).
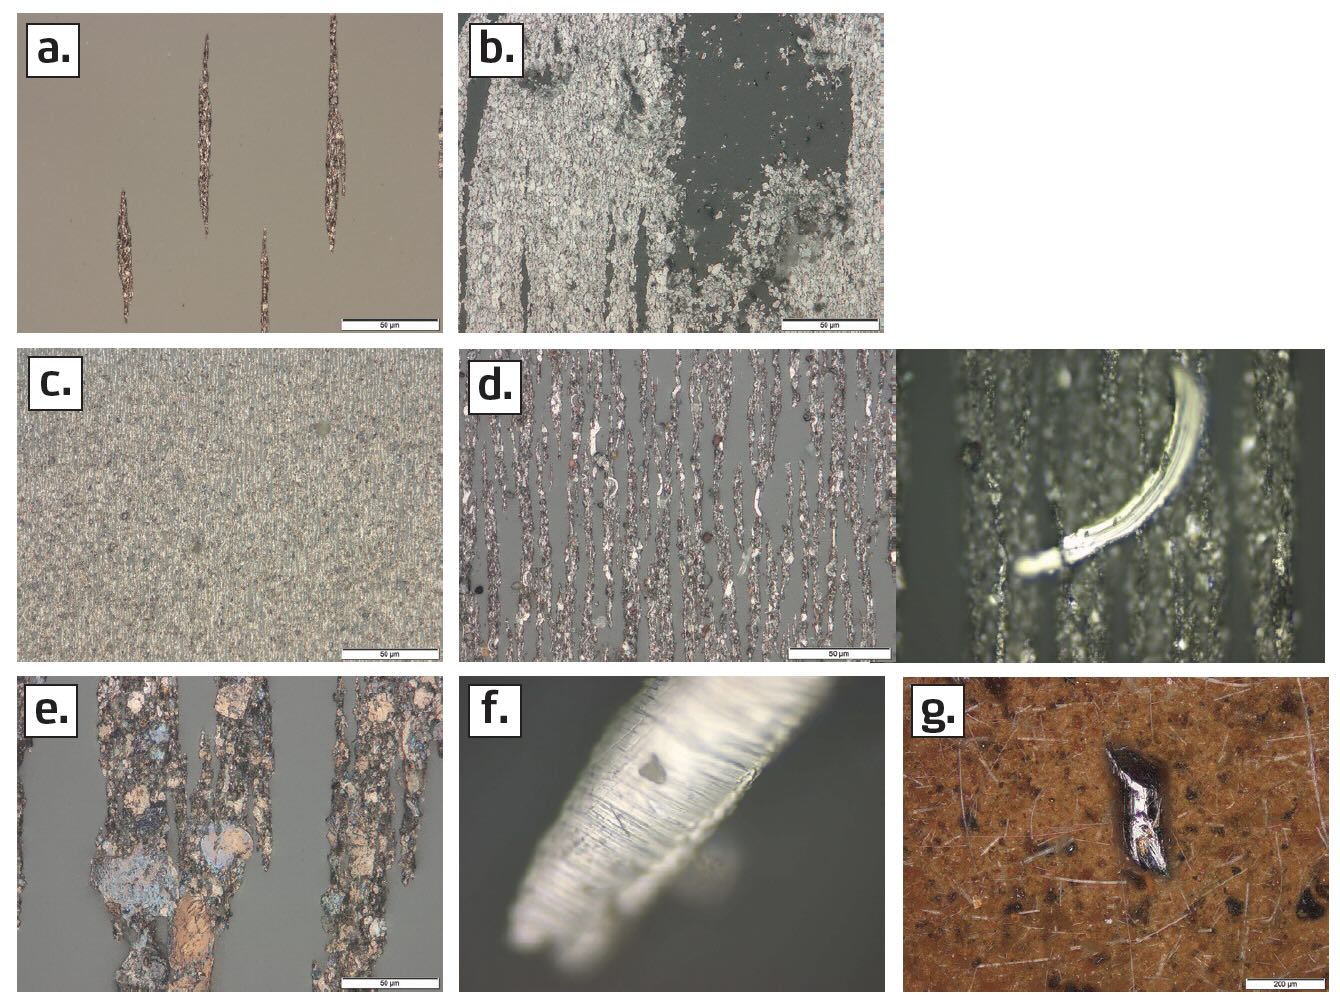 Figure 4. Various wear modes produce characteristic particles: (a) rubbing, (b) fretting, (c) corrosion, (d) cutting, (e) reworking, (f) sliding and (g) fatigue. Figure courtesy of POLARIS Laboratories®.
Fretting wear can be caused by parts being misaligned, and it is often observed in systems with rolling element bearings. It is caused by a mild but consistent rubbing between two interacting surfaces. Fretting wear particles are often in the 1- to 15-micron size range. They have a platy form, and deposits on a microscope slide can resemble reptile skin
(see Figure 4b).
Corrosion wear particle deposits appear like sandpaper under the microscope
(see Figure 4c). These particles are generated when the environment or the lubricant itself contain corrosive factors. Corrosion products are usually stripped from a metal surface during startup, when boundary lubrication occurs, and this effect can be more pronounced if the affected equipment has been inactive or in storage for an extended time. Corrosion wear particles are usually smaller than one micron, and because they are oxidized, they typically deposit on the end of the microscope slide with the nonferrous particles in a ferrography test. These particles are harder to distinguish from other types of particles in a micropatch test.
Cutting wear (also called abrasive wear) occurs when a hard particle slides over a softer metal surface and gouges a piece out of the metal. This type of wear can occur when parts are misaligned or when abrasive particles are present in the system. Wear particles are generally larger than 15 microns, but they can also be much smaller
(see Figure 4d).
Reworked wear particles typically form via another wear mode and become altered when they pass between rolling surfaces. They are found in high frequency near bearing raceways or rolling elements or in gear pitch lines. These particles are typically platy and larger than 15 microns in at least one dimension
(see Figure 4e).
Sliding wear occurs under abnormal loading, which can be caused by using a lubricant with the wrong viscosity grade for the ambient temperature or by excessive speed. Sliding wear particles typically have a flattened, elongated shape and surface striations
(see Figure 4f). Sliding wear is a severe wear mode, and it can produce thermal discoloration and fatigue wear from cyclic loading.
A new piece of equipment in its break-in phase can have impurities on its metal surfaces, and these impurities can break off of the surface under fatigue wear and go into circulation. The particles are generally thick rather than flattened, and they may have sheared edges or surface pitting
(see Figure 4g).
Whereas all particles deposit randomly on a patch, copper and aluminum wear particles also deposit randomly on a slide
(see Figure 5a). Aluminum particles do not change color when a slide is heated to a temperature that will discolor ferrous particles
(see Figure 5b). Copper takes on a range of colors when exposed to heat. Although ferrous wear is expected, nonferrous wear is not expected. However, nonferrous wear particles are tolerable in low frequency.
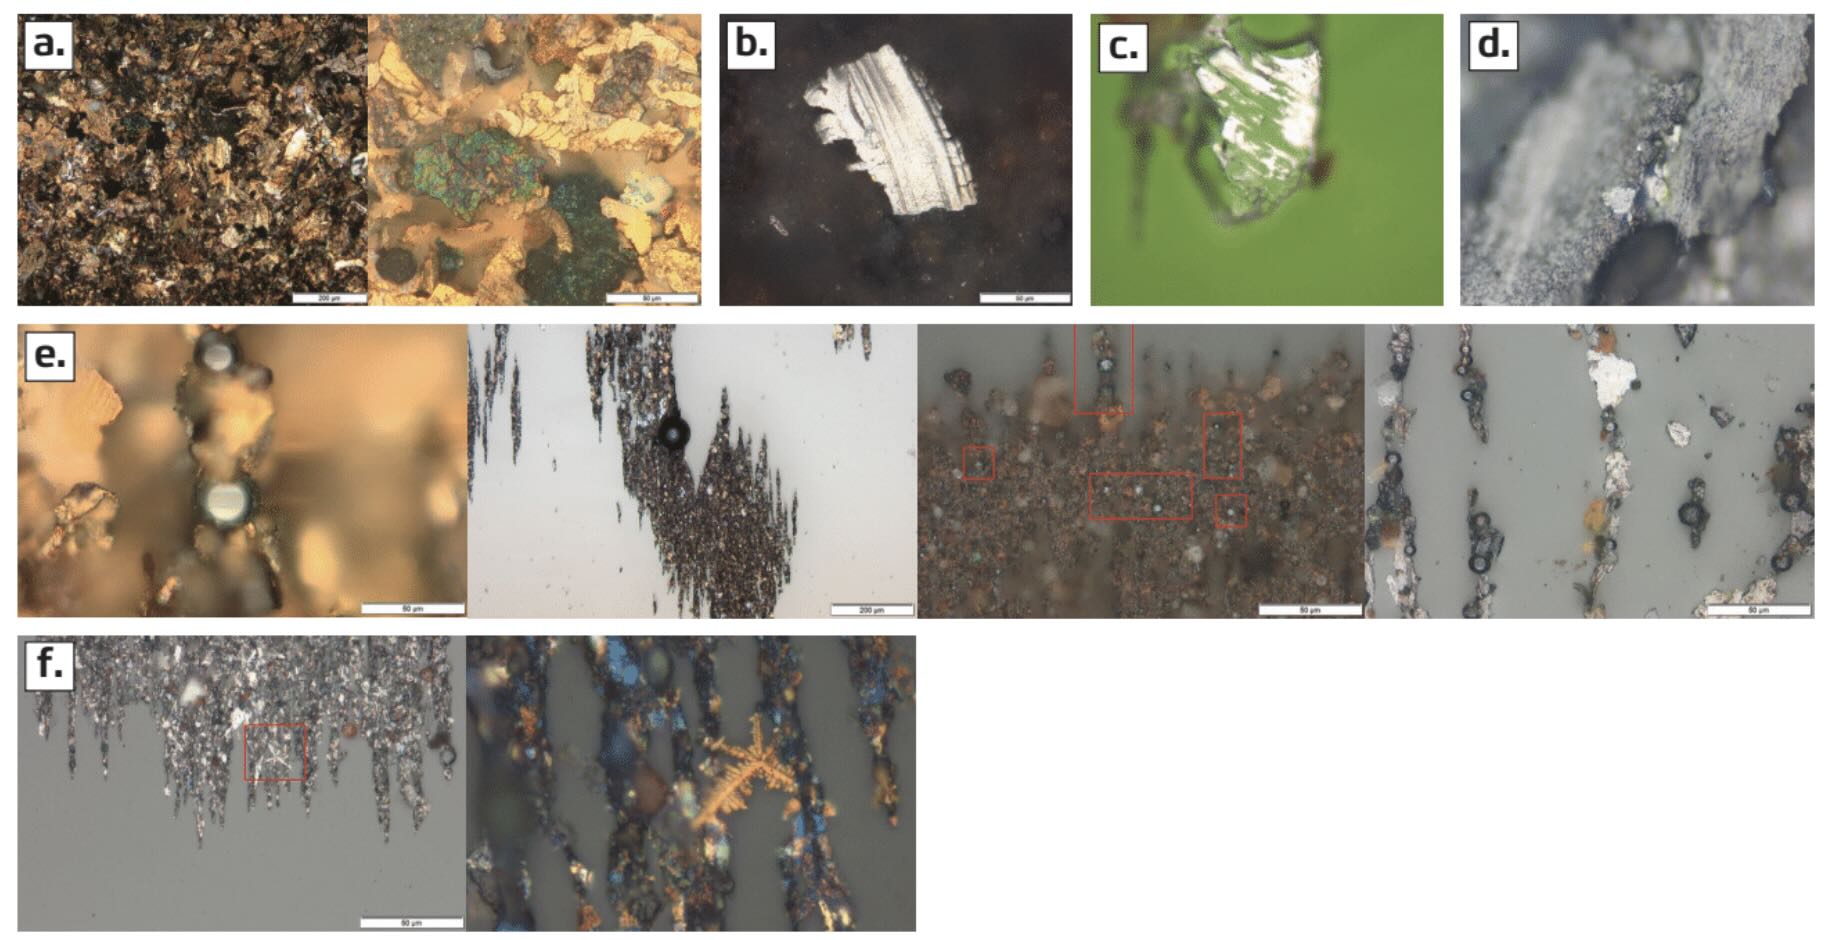 Figure 5. Wear particle materials can be indicative of their source: (a) copper alloy, (b) aluminum, (c) Babbitt alloy, (d) lead, (e) metallic spheres and (f) dendrites. Figure courtesy of POLARIS Laboratories®.
Babbitt alloy particles are relatively unusual because of the limited number of applications the alloy is used in and its high manufacturing cost
(see Figure 5c). Elemental analysis showing tin, with lower amounts of antimony and copper, can confirm the presence of Babbitt alloy. Because this alloy is soft and malleable, it shows up on a ferrogram slide as mottled edges at a temperature where moderate steel begins to discolor. Lead alloys will have a characteristic gray metal sheen
(see Figure 5d). Elemental analysis of an acid-digested sample can confirm the presence of lead particles.
Metallic spheres are usually produced by cyclic stress, and they can appear fresh or oxidized
(see Figure 5e). Metallic spheres are a precursor to fatigue or spall wear, but they can also come from external contamination or processes like grinding or welding. They can come from break-off from steel casting imperfections in a new piece of equipment. Metal spheres also form when electric current passes through poorly grounded components, or from static discharge at the filter element.
Dendrites typically form when equipment is improperly grounded
(see Figure 5f). They can form by themselves or with metal spheres when electric currents travel to ground through metal components. The higher the frequency of the arcing, the more energy is dissipated throughout the bearings and other components. The resulting heat generation can accelerate lubricant oxidation, and it can cause rapid equipment failure. A strong enough current can cause a harmonic imbalance, which causes excessive vibration. This is particularly concerning with work performed in a radial motion (e.g., shafts and radial load bearings). Thus, any amount of dendrites observed during sample analysis will result in a red flag on the laboratory report.
Interpreting the results: Case studies
Case 1
Routine elemental analysis of a lubricant sample taken from the hoist gearbox on an articulated dump truck exhibited elevated copper levels, along with sodium and water. The customer wanted to know whether the copper was coming from wear or leaching. Analytical ferrography showed rubbing and corrosive wear particles 1 micron in size, along with one metallic sphere. Some abrasive particles were also present, which was not unexpected for an engine lubricant sample from a piece of construction equipment. No copper wear particles were observed on the microscope slide, so the copper had probably leached from a mechanical component into the lubricant, possibly in conjunction with the water entering the lubricant, with the sodium acting as a catalyst. This could have occurred when the customer changed the lubricant, or they could have taken a cold sample.
The sampling temperature is significant because at lower temperatures, any water condensate that builds up in an oil sump does not have a chance to evaporate or drop out of suspension, as it would at operating temperatures. A lubricant with a high content of dispersant additive (e.g., an engine lubricant) facilitates water evaporation at operating temperatures because the water droplets are small and dispersed. Applications where moisture may affect equipment operation (e.g., hydraulics or compressors) should use lubricant products that readily separate from water for a drain-off maintenance procedure. In either circumstance, the water should not be present in a representative oil sample unless there is a contamination fault. The laboratory staff recommended moderate caution and continued monitoring of the trend.
Case 2
Elemental analysis of a sample from a dredging pump thrust bearing showed elevated iron and copper, along with the presence of lead and tin. Typically, iron, chromium and nickel indicate a moderate to high-strength steel alloy. Copper, lead, zinc and tin are indicative of brass. The other lubricant properties were consistent with past test results, but a Karl Fischer test indicated 5,000 parts per million of water. Particle analysis showed rubbing wear with some reworked wear particles. Copper alloy particles and red oxides were also present. The streaky deposits showed pitting, but no striations were present, so the particles could have been produced from fatigue arising from overloading or stress during boundary lubrication, possibly caused by water washout of the lubricant. There was also evidence of lubricant degradation and friction polymer formation. The microscope slide had transparent circular areas with no deposits, indicative of free water droplets that were immiscible in the heptane solvent. The presence of water and wear particles could be an indication that water contamination had reached the point where it was damaging a bearing. The laboratory recommended an inspection of the bearings and identifying the source of the water contamination.
Case 3
A sample from a large offroad vehicle engine showed moderately elevated (but higher than normal) levels of iron, copper, lead and tin. Some additives were present at higher levels, possibly because of a recent lubricant change. Aside from the metal levels, none of the sample’s characteristics (e.g., pH, viscosity) showed cause for concern, and there was no evidence of soot, fuel or pollution. The copper and lead levels were atypical for this type of engine, however. There was some evidence of corrosive wear and rubbing wear, with a small number of reworked particles that looked oxidized and some sub-particles that could have formed from larger particles. The copper particles were fairly large, in the 40-micron size range, which was concerning. However, the number of copper particles was low enough that an inspection or teardown of the engine was not warranted. A filter debris analysis could be performed to identify the mechanical fault that was producing the particles and indicate whether the copper particles were a sign of a worsening wear problem.
Case 4
Another sample came from a diesel engine used in a mobile piece of equipment owned by a construction company in the U.S., but no other information was provided. The mass of wear metal debris obtained from ICP analysis was in a relatively common range, except for lead, when the metallic elements derived from the oil formulation itself were taken into consideration. However, the acid digestion preparation indicated that the copper, lead and tin levels were very high, possibly indicating bearing wear. The sample also had some aluminum, in conjunction with iron, chromium and nickel, possibly from an engine cylinder. The lead could have been from crankshaft wear. However, metals from a moderate- to high-strength steel crank shaft or cam shaft would also have produced iron, chromium, nickel and possibly manganese or titanium.
The microscope analysis sample showed some abrasive particles (silica is not broken down by acid digestion). Some of the ferrous particles showed sliding wear, and some of these particles had been reworked. Recirculated sliding wear had produced cutting wear particles, and some particles had the gray sheen typical of lead. Corrosive wear particles were also present. Because there was not excessive soot loading, the wear particles and abrasives were the main source of the mass of particulates in the sample. Thus, the sample was flagged as being of significant concern. The high amount of lead was probably from bearing wear, and the iron, chrome and nickel posed a concern for the crankshaft region.
These examples illustrate how microscopic analysis, used in conjunction with customer-provided information and other analysis techniques, can provide clues as to the source and severity of a mechanical or lubricant problem. Early identification of developing problems allows the customer to determine whether continued monitoring is sufficient, or if they need to take corrective action before the problem worsens.
Nancy McGuire is a freelance writer based in Albuquerque, N.M. You can contact her at nmcguire@wordchemist.com.