Meet the Presenter
This article is based on a webinar presented by Tevis Jacobs and the Tribology Division of the American Society of Mechanical Engineers (ASME) on Sept. 21, 2022. The title of the webinar is Towards a Predictive Understanding of the Effect of Surface Topography on Surface Properties. The Tribology Division of ASME is established to serve the members and associate members of the ASME who have designated their interest in the science and technology of tribology. For more information, visit www.asme.org/get-involved/groups-sections-and-technical-divisions/technical-divisions/technical-divisions-community-pages/tribology-division.
Tevis Jacobs is a William Kepler Whiteford faculty fellow and associate professor in the Department of Mechanical Engineering and Materials Science at the University of Pittsburgh. He received his doctorate degree in materials science and engineering from the University of Pennsylvania, where he also did his postdoctoral work. He is a recipient of the STLE Early Career Award and the CAREER Award from the National Science Foundation. You can reach him at tjacobs@pitt.edu.

Tevis Jacobs
KEY CONCEPTS
•
Surface roughness measurements using different instruments, size scales and scanned areas can produce widely varying results for a given material, and it’s not clear ahead of time which scales matter most.
•
Standard roughness metrics are convenient, easy to calculate and easy to understand, but they have limited utility for predicting performance.
•
Analytical models or “brute-force” integration methods that incorporate the science of friction or mechanical deformation provide the best predictive information.
Surface roughness affects adhesion, friction and wear in real-life applications like the thin films and substrates for precision semiconductor manufacturing and the surfaces of tools that touch sensitive components. The roughness of a robotic gripper and the object that it’s gripping allow the gripper to hold the object securely and turn it loose at the right time
(see Figure 1). The roughness of an insulin pump syringe barrel controls the friction of the plunger, which, in turn, controls the dosage of insulin delivered to the patient. In a similar manner, the roughness on the inside of a vehicle cylinder bore controls its performance. Properties like the hydrophobicity of a given material and a given chemistry can vary widely depending on the surface topography.
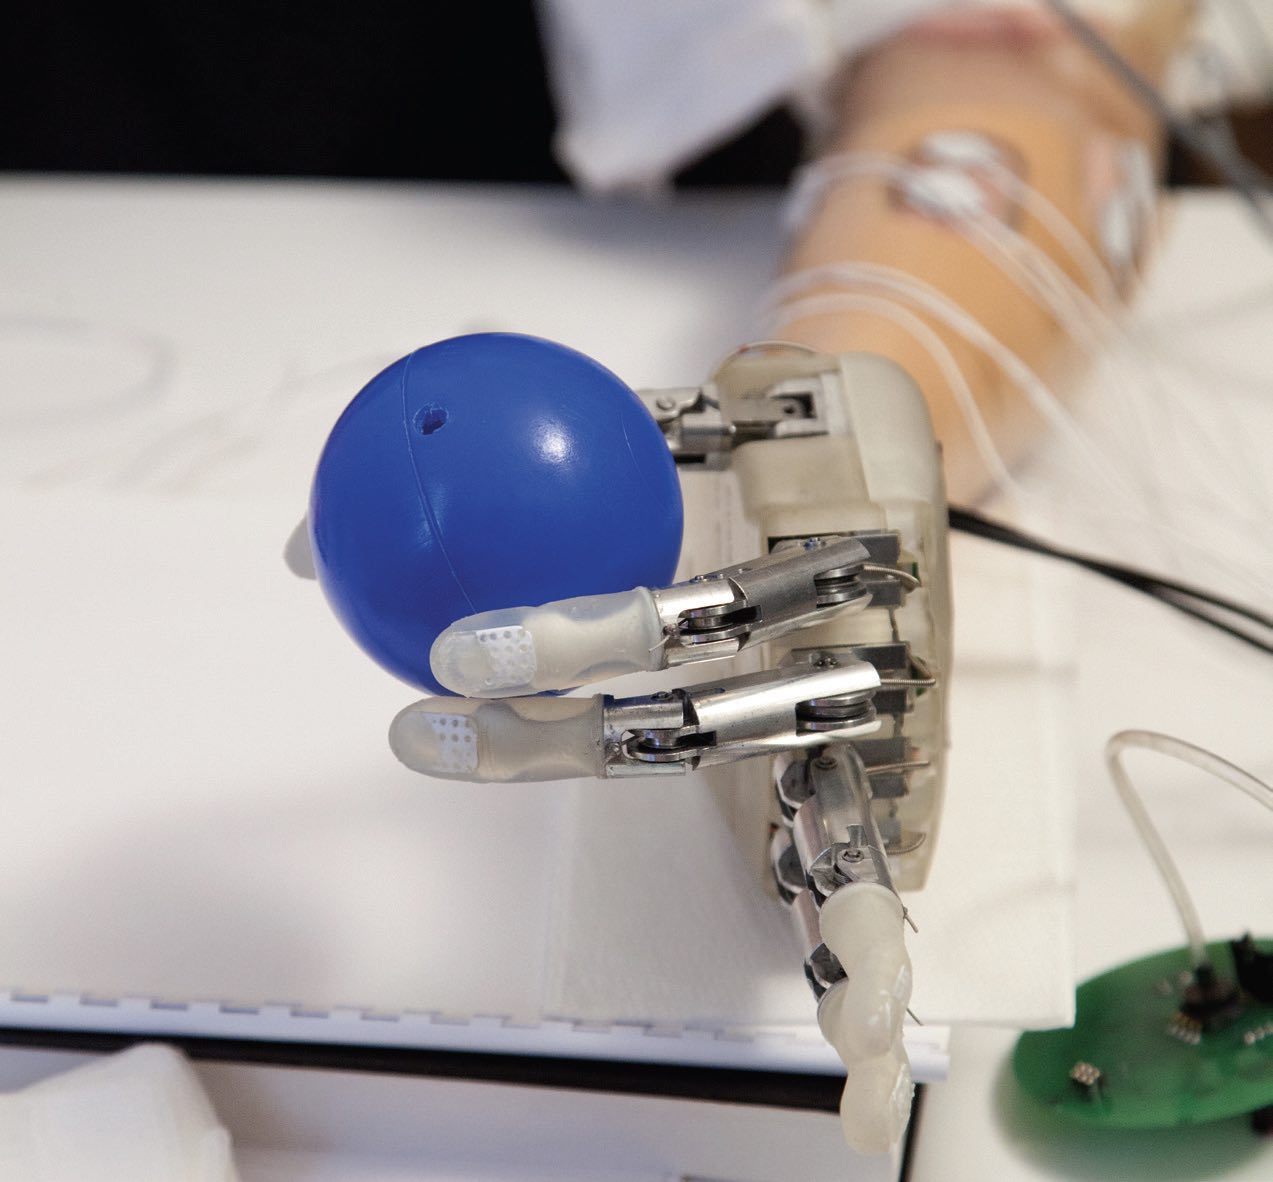 Figure 1. Surface roughness strongly affects friction, which affects how effectively robotic grippers can hold an object. Figure courtesy of Università Campus Bio-Medico di Roma/Flickr, CC BY-NC-SA 2.0.
How does surface roughness affect these properties so strongly? In 1950, F.P. Bowden said that putting two solid surfaces together is like turning Switzerland upside down and standing it on Austria—the topography of the two surfaces determines whether you have conformal contact everywhere or peaks and partial contact. Topography determines the contact pressure distributions, and those in turn control performance of things like adhesion and friction. How do we engineer topography to achieve the optimal performance? To begin with, we need some means of quantifying the ways that surface topography affects specific properties of a material.
This article is based on a webinar presented by Tevis Jacobs, William Kepler Whiteford faculty fellow and associate professor in the Department of Mechanical Engineering and Materials Science at the University of Pittsburgh, and the Tribology Division of the American Society of Mechanical Engineers (ASME) titled Towards a Predictive Understanding of the Effect of Surface Topography on Surface Properties. See Meet the Presenter for more information.
Limitations of the simple approach
One approach is to take a property of interest, like cell adhesion to an engineered bone tissue scaffold, and plot it against an independent variable. This variable might be some simple metric like average roughness—the average height deviation from a midline value for every point on the surface. In some cases, this simple scalar metric works well, but you often find that if you run the measurements again in different conditions or with different materials, you get conflicting results.
For example, one atomic force microscope (AFM) study showed that a higher percentage of cells adhere to smoother surfaces.
1 However, a stylus profilometry study of a wide variety of materials showed that the rougher the substrate, the better the cell adhesion.
2 And one review paper on engineering bone tissue scaffolds to support bone regrowth stated that the effects of surface roughness and grain size on cell adhesion is inconclusive because of contradictory data in the literature.
3
Three problems cause this standard approach to fail. First, researchers typically use a single measurement size—for example, using AFM or stylus profilometry—which fails to capture the multiscale nature of roughness. Second, standard roughness metrics are convenient, easy to calculate and easy to understand, but they have limited utility for predicting performance. Third, these types of analysis do not incorporate the science of friction or mechanical deformation: they are “science-free.” This article discusses each of these shortcomings and how surface studies can yield more useful information.
The multiscale strategy
To address the problem of a single measurement size, Jacobs’ research group investigated ultra-nanocrystalline diamond (UNCD), a wear-resistant coating. UNCD has many of the desirable properties of diamond, but it also can form coatings on the complex surfaces of medical devices, micro-electromechanical system (MEMS) devices, seals, bearings and similar surfaces
(see Figure 2). For their study, they investigated topography across a wide variety of size scales.
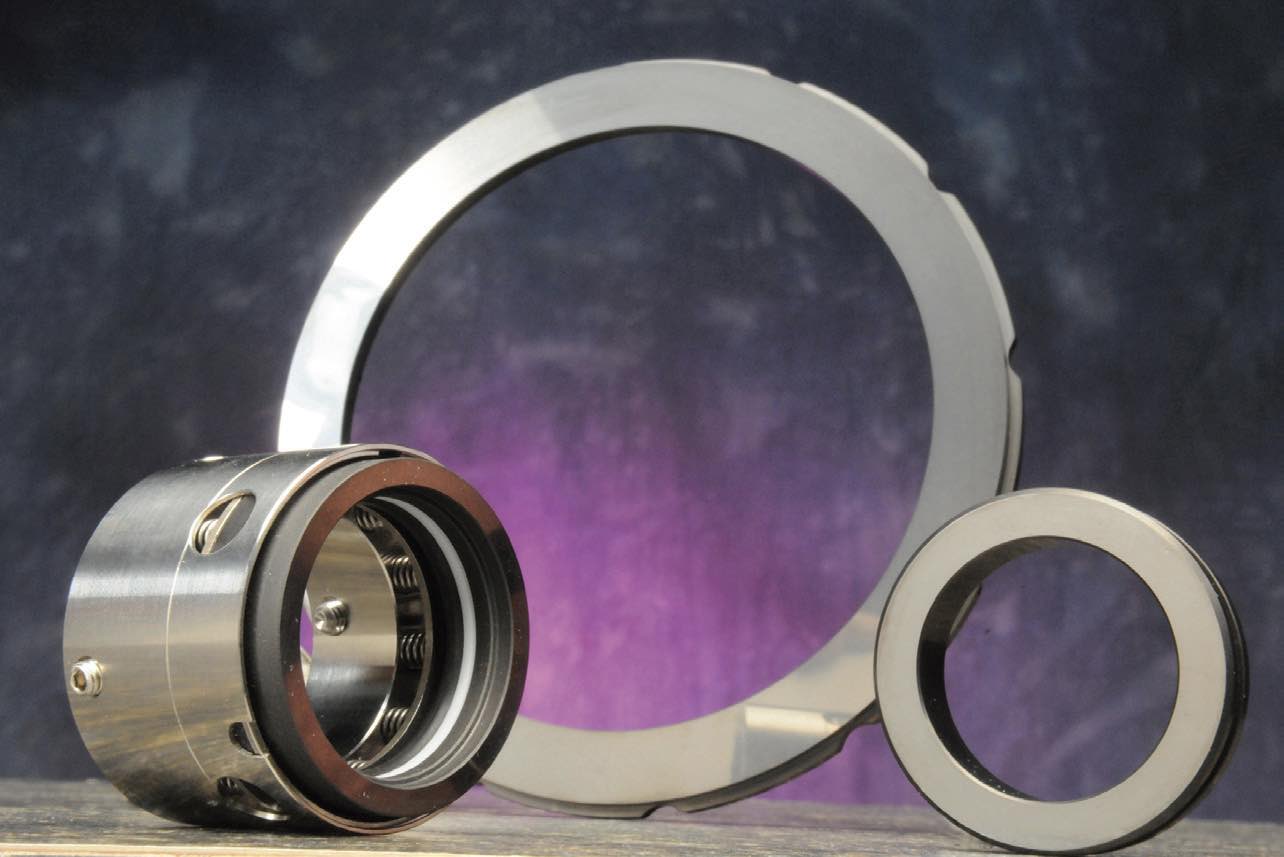 Figure 2. Pump seals coated with UNCD have a mirror-like finish. Figure courtesy of Argonne National Laboratory/Flickr, CC BY-NC-SA 2.0.
Using a stylus profilometer to scan the surface and measure the height at every lateral position yields a surface topography plot with nanometer-scale height differences over millimeters of surface area. A stylus tool can measure over various scan lengths from, say, 10 mm down to 0.5 mm. The research group measured the same material using an AFM, to capture the roughness data at the 100-micrometer scale down to tens of nanometers. Although this two-method, multiscale approach is not commonly done, it yields useful information on the fundamental science of topography.
Going still further down in size, they use the even less-common technique of transmission electron microscopy (TEM) to reveal the grain structure and the atomic lattice structure, giving topography information down to the angstrom scale
(see Figure 3).4 Using image analysis to extract and digitize the surface contour shows that this coating, which appears mirror-smooth and conformal at visual scales, is quite rough on the scale of single-digit nanometers.
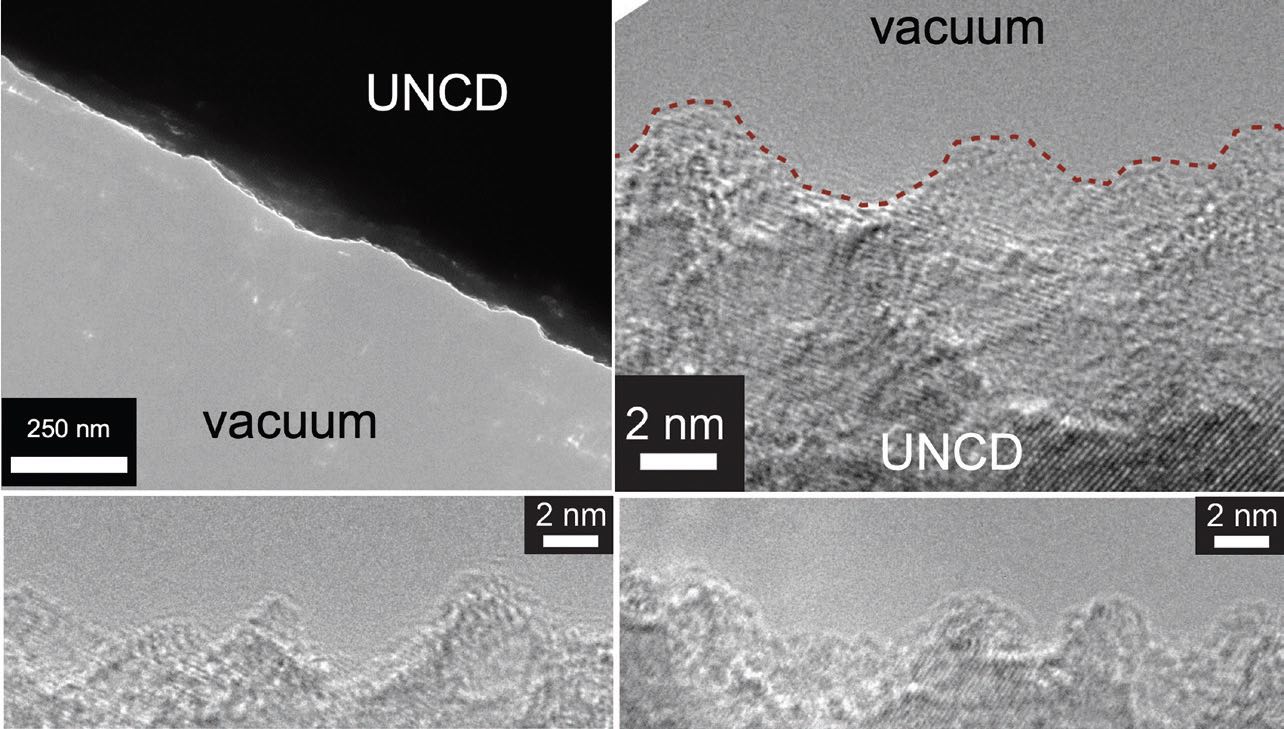 Figure 3. TEM images show UNCD surface roughness, lattice fringes. Figure courtesy of Tevis Jacobs.4
Calculated roughness parameters can vary tremendously within techniques and between techniques. The root-meansquare (RMS) height variation varies by more than an order of magnitude across size scales. Other parameters that are suggested in the scientific literature like RMS slope or RMS curvature vary by several orders of magnitude. The increase in surface area due to roughness might be only 0.1% when measured on the largest scale; but when measured on the smallest scale, it might increase by double. These simple scalar values are very sensitive to the size of the measurement, making it difficult to correlate roughness metrics with any important measure of performance.
Worse yet, it’s not clear ahead of time which size scales will control the performance in a given application. The scientific literature on adhesion, friction, biocompatibility and other roughness-dependent properties contains many examples where the macroscale performance is governed by the nanoscale roughness, even though this nanoscale roughness might be difficult to measure or control. One best practice to understand roughness-dependent performance is to measure the topography at a wide variety of scales, and even better, using a wide variety of measurement techniques.
Going beyond traditional roughness metrics
Once you have stylus profilometry measurements and AFM scans, and possibly TEM images, what do you do with all that data? We know that simple scalar metrics give widely varying results depending on the scale of the measurement. Taking an average of all roughness measurements would obscure the size-dependent information, but how do we do better?
It’s hard to know ahead of time which scale matters most for a given problem, so why not measure all of them and then separate out their contributions using a mathematical tool? One common method is power spectral density (PSD), which is the square of a Fourier transform. This method separates out the roughness contributions from different length scales, and it works with fractal and non-fractal surfaces.
5 The PSD can be intuitively understood as the “recipe” for a surface. That is, if you were adding up sinusoidal waves of different wavelengths, what amplitude would you need from each size in order to reproduce the statistics of this surface?
To illustrate, let’s look at the stylus profilometry, AFM and TEM dataset discussed previously. The stylus data is plotted from measurements at all size scales. Although it can measure at nanometer sizes, the scanning tip is so large that no reliable data can be measured at lateral sizes smaller than about a micrometer. AFM data has a similar reliability cutoff because of tip artifacts, but AFM is capable of measuring roughness down to the scale of tens of nanometers. For more detailed studies, TEM roughness information can extend down to the nanometer region. This multiscale approach does not require any fitting parameters, because the data from the various techniques can be integrated into the same plot. The agreement is quite good
(see Figure 4), and the combination of techniques yields a comprehensive description of a single surface, from the centimeter scale down to the atomic scale.
6
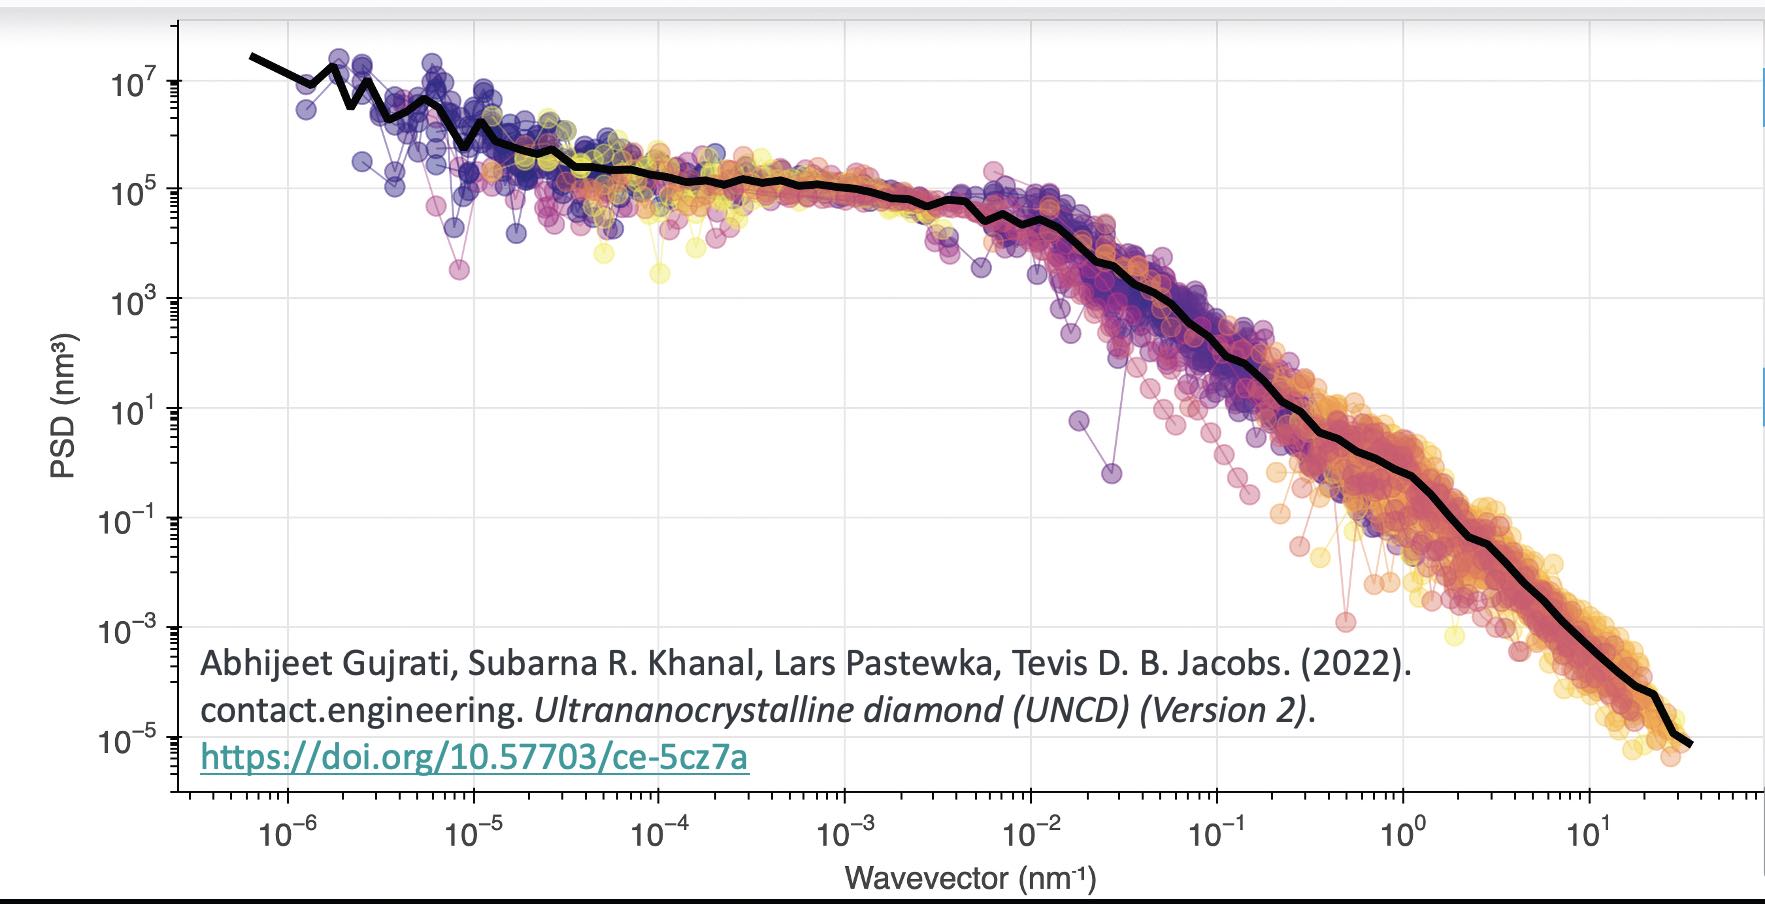 Figure 4. TEM, AFM and profilometry data provide quantitative topography characterization over a range of scales. Figure courtesy of Tevis Jacobs.15
Where this gets particularly interesting is when you compare different substrates. The research group examined a variety of nanocrystal diamond coatings with a variety of grain sizes and polishing conditions. As the grain size goes up, the measurements confirm an increase in surface roughness, at least at the larger scale. In the stylus and AFM measurements, the small-grain UNCD is far smoother than the larger-grain nanocrystalline diamond or microcrystalline diamond.
7
However, at the single-digit nanometer scale, the roughness of those three materials is identical. This result is not necessarily what you would predict, but it can be understood since all of these materials are made of diamond, and they are being examined below the size of a single crystal grain. More surprisingly, in the midrange (about 10 nanometers), the UNCD actually has the roughest surface of all. For context, the average surface slope of ultra-flat UNCD at this scale is steeper than that of the Austrian Alps when measured on the scale of a human step. Thus, it’s not possible to even extrapolate surface roughness parameters from one size to another. A surface that is rougher on one scale might be smoother on a different size scale.
Using science instead of statistics
Once there is this information about topography, how can we use it to predict performance? Is it possible to move beyond the statistical correlations that are typically used? Yes! Large numbers of numerical and analytical models are already available to predict behavior.
8 Each of these methods lets you make concrete predictions for adhesion, friction and other surface properties. However, the typical barrier to entry to these methods is that researchers and manufacturers lack a comprehensive description of topography—they just don’t have the data to put in the models.
In Jacobs’ group’s ongoing research efforts, they are using science-based analysis based on multiscale measurements. These significantly outperform the traditional methods, which use statistics-based analysis based on conventional roughness metrics. For example, they are collaborating with Prof. Ali Dhinojwala at the University of Akron to use roughness measurements to understand the stickiness of silicone rubber. Dhinojwala is an expert at making silicone (polydimethylsiloxane or PDMS) spheres with carefully controlled chemistry, modulus, shape and roughness. The research group pressed these spheres into contact with flat samples made of their four flavors of polycrystalline diamond (microcrystalline, nanocrystalline, ultrananocrystalline and polished ultrananocrystalline), applied a load and then pulled the spheres off.
9
They found that the PDMS rubber was far stickier during separation than it was when coming into contact. In other words, at the same load, the contact size was much larger on unloading than it was on loading. Also, they measured a large maximum adhesive load upon separation that was higher than anything observed during contact. They repeated the test with the four different roughnesses of substrates and four different stiffnesses of the silicone. The results showed very different behavior, in contact size and adhesive force, across the different contacts.
In the end, they analyzed the 16 different combinations of materials. Would the conventional “science-free” approach work for describing adhesion? First, they calculated a scalar metric: adhesive force versus RMS height. They looked for a linear correlation but failed to find one. The UNCD had a higher pull-off force than the medium-roughness material, but there was no simple correlation between them. Plotting all of the different moduli values only made the picture more complex. So, out of necessity, they built in the science to gain a predictive understanding.
The research group used a model by Bo Persson that balances the energy gained from making contact (intrinsic work of adhesion) against the energy penalty required to achieve conformal contact. The model captures how a soft surface will conform to a hard, rough surface, gaining some adhesion energy—the surfaces are happy to stick—but incurring a penalty in elastic energy. This concept enabled them to relate the properties that they needed to apply this model to the known mechanical properties and the measured topography of their materials. By applying this model, using the power spectral density, they were able to accurately describe and predict the dependence of adhesion on topography.
10
Using this approach, you lose the satisfying equation of roughness on the X axis, with the property of interest on the Y axis. Instead, you wind up plotting the model-predicted performance on the X axis and the experiment-measured performance on the Y axis. But what you lose in pretty pictures, you more than make up for in accuracy and predictive power for real-world applications.
For other types of work, the Persson model works less well, and a brute-force calculation is required. For example, the group examined two hard surfaces in contact—a 0.5-millimeter ruby (alumina) sphere in contact with their four types of polycrystalline diamond. The experimental setup was conceptually similar to that used for the silicone rubber sphere: They put the surfaces into contact, applied some light but finite load, and then pulled off and measured the adhesive force holding the materials together. The measurements produced many different pull-off forces with a lot of scatter in the data. So, they repeated the measurements thousands of times, each in a new location on the sample with multiple different spheres on the substrate, to produce distributions of pull-off forces.
A reality of rough surfaces, especially for hard materials, is that you get a wide distribution of the property of interest, but this need not be an obstacle. They got very different results for the microcrystalline diamond compared with the nanocrystalline, ultrananocrystalline or polished ultrananocrystalline diamond. There were very significant differences in adhesion between the materials
(see Figure 5). Note that the bar chart is on a log scale, so the differences are greater than they appear on the plot. Once again, as hard as they tried, they could not get the measured trends to obey simple linear correlations with standard roughness metrics.
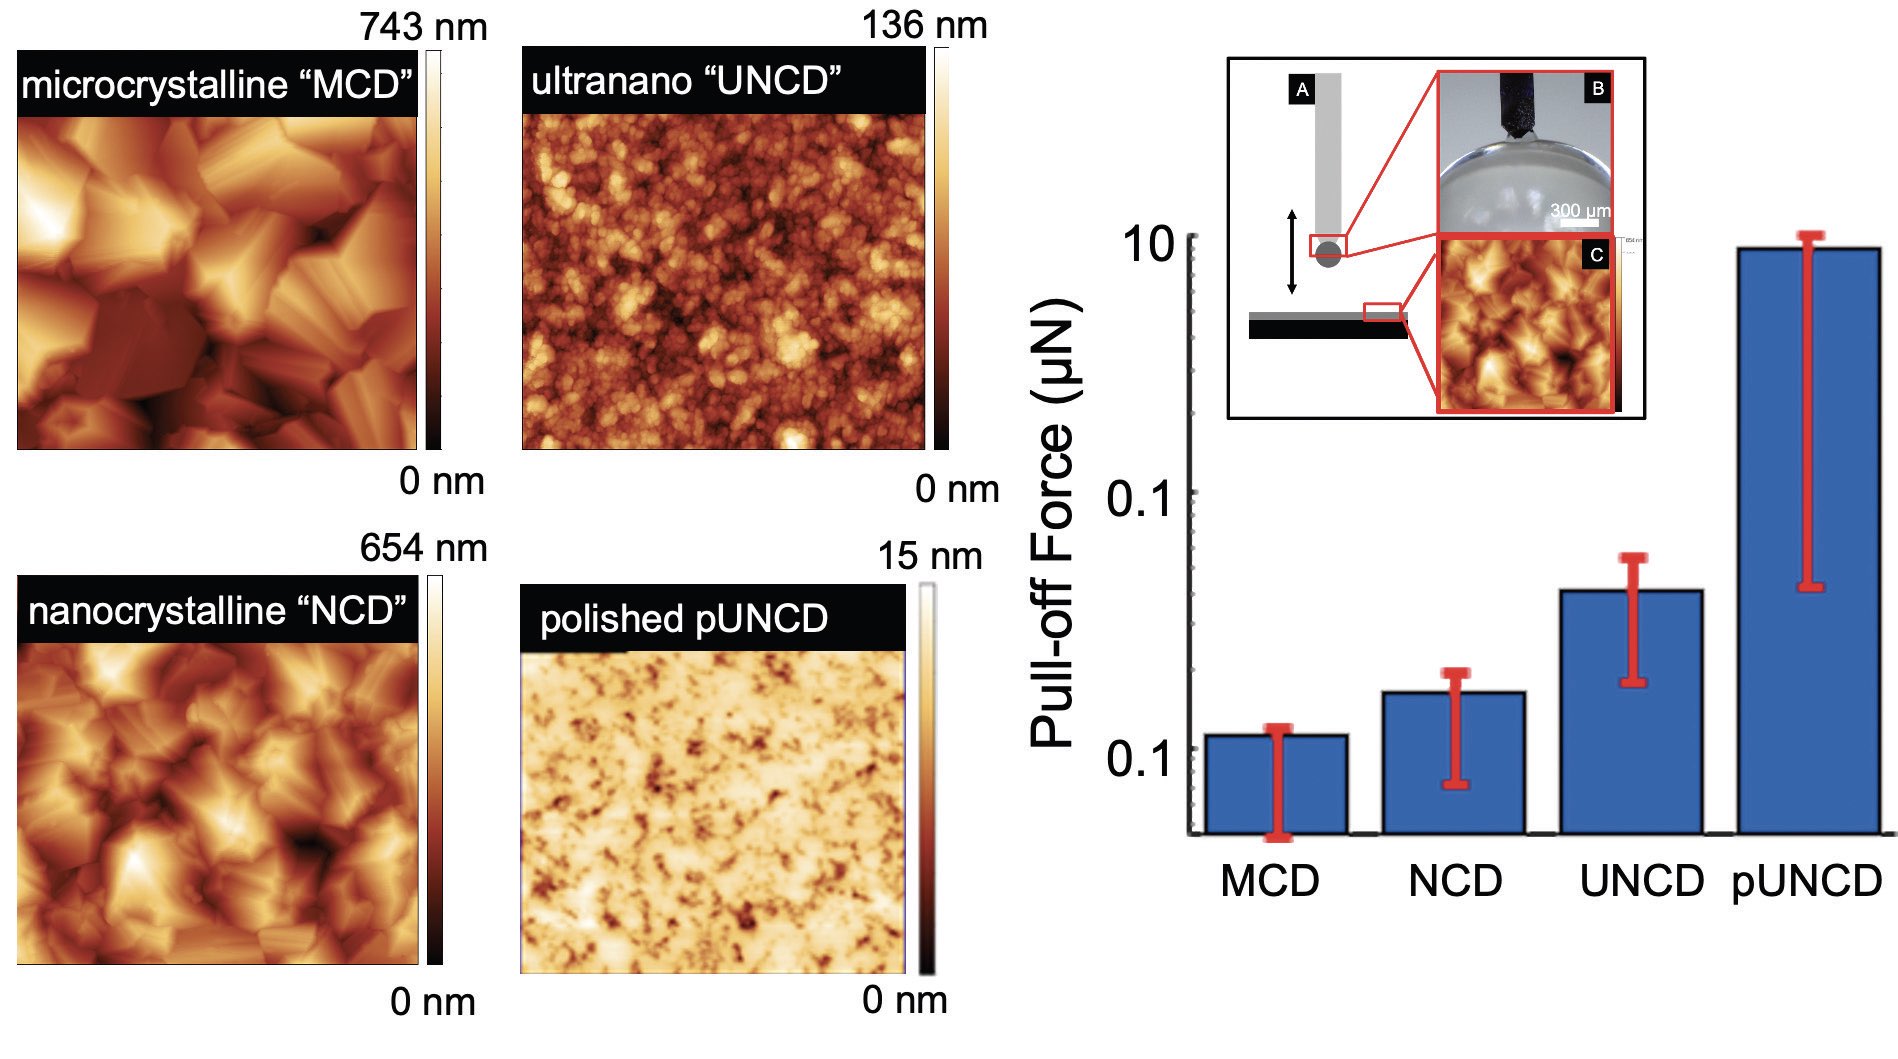 Figure 5. Pull-off forces for ruby sphere in contact with four types of diamond surfaces. Figure courtesy of Tevis Jacobs.
Instead, they used a brute-force approach and numerically integrated in a pixel-by-pixel fashion
(see Figure 6).11 In this approach, you can extract intrinsic material properties from your measurements or assume them from prior work. Once you have the intrinsic material parameters, you can make predictions for future results. In this case, the research group showed that below a scale of about 40 nanometers or above a scale of about 2 micrometers, the roughness really plays no role in adhesion for the ruby on diamond surfaces— instead, there’s a critical range of size scales that controls performance in this case.
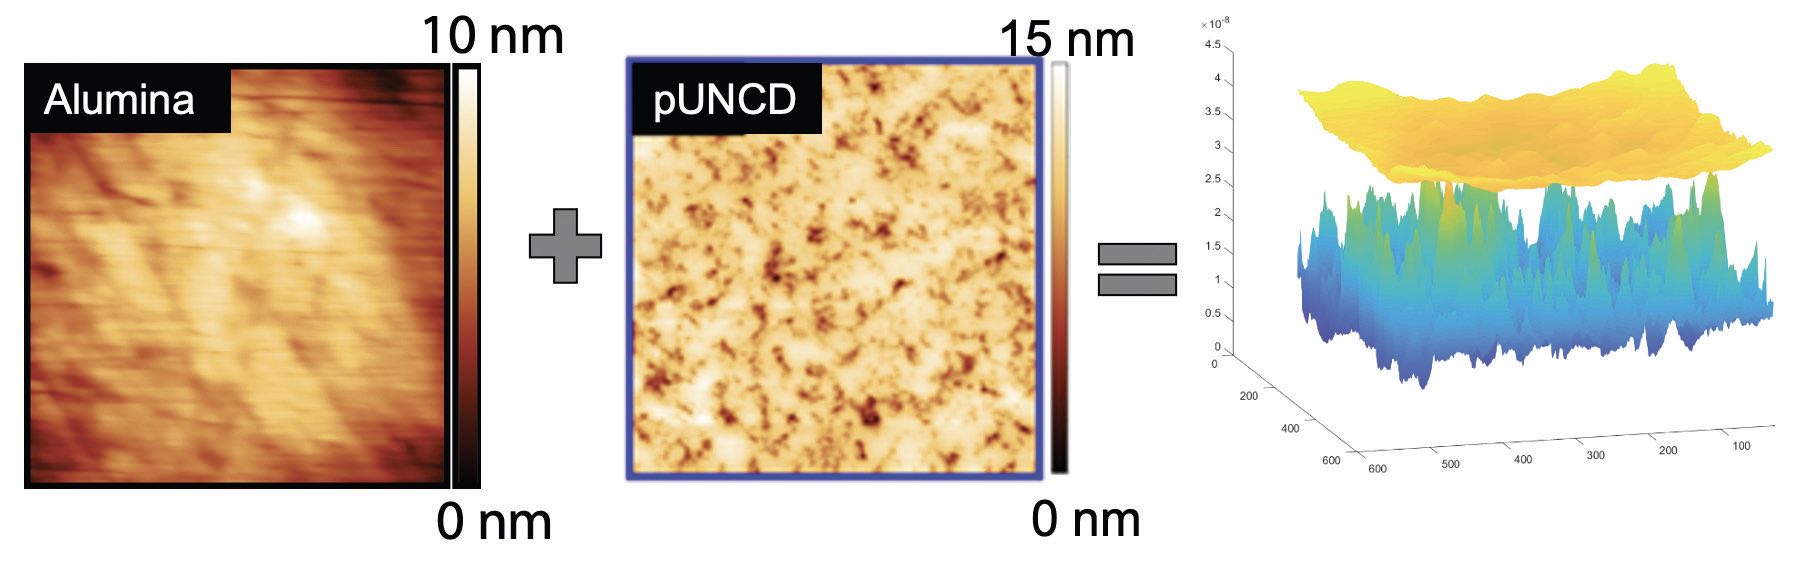 Figure 6. Pixel-by-pixel integration for calculating pull-off force. Figure courtesy of Tevis Jacobs.
However, these roughness scales do not always control behavior. Instead, it’s not typically clear ahead of time which size scales matter. For instance, the group applied similar methods to understand friction between a shoe sole and a floor.
12 A shoe sole is stiffer than PDMS rubber, but not as stiff as nanodiamond coatings. How does the floor topography control friction, especially in the context of slipping and falling accidents? They also looked at bioactivity of neural implants,
13 showing which scales matter and correlating those scales to the size of peptides of proteins or the neural cells themselves.
The specific scale of roughness that controls performance probably varies widely depending on the specific use case. But if you measure many size scales and you use scale-dependent metrics, you can capture all of that variation and account for it. Thus, a strategy that leverages the science can use either analytical models or a brute-force integration approach, and it can give significantly more accurate predictions than statistics-based correlations.
Ready to begin?
Jacobs’ research group collaborated with Lars Pastewka’s group at the University of Freiburg (Germany) to build a free, opensource software platform for topography analysis that anyone can use (
https://contact.engineering/).
14 The user uploads raw topography data into a secure storage area, creating digital surface twins of their material
(see Figure 7). The software platform allows users to analyze data of different types and in different formats together, and across all size scales.
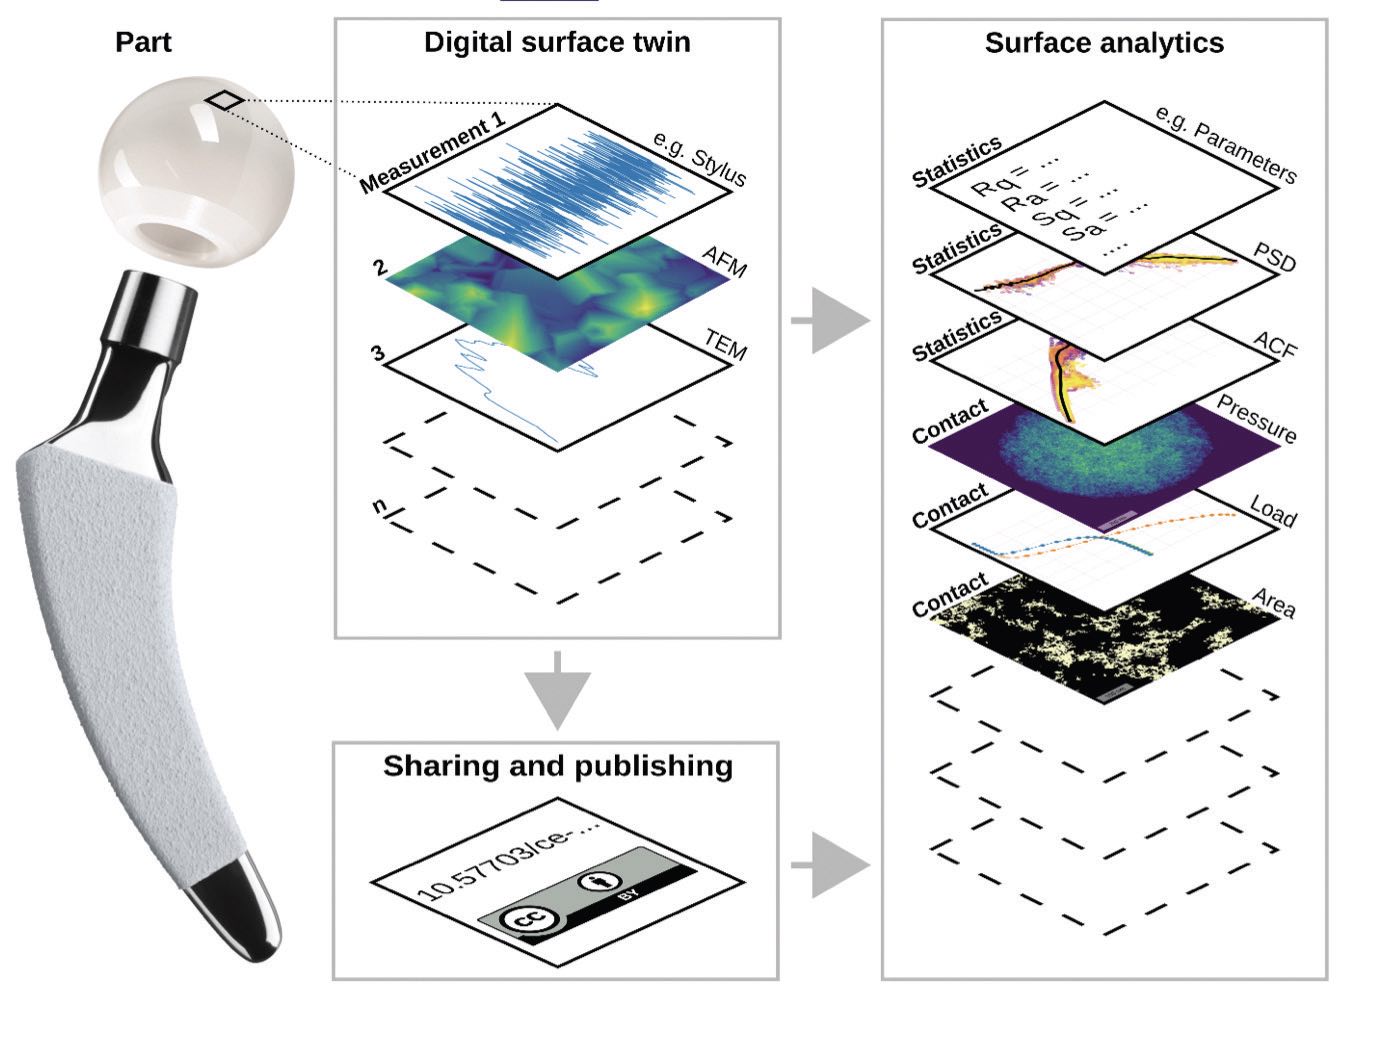 Figure 7. Digital surface twin and surface analytics for an artificial joint replacement ball. Figure courtesy of Tevis Jacobs.14
Users are encouraged to publish their topographies so that theoreticians and modelers can include the data in their models and experimentalists can compare their own data to the published data.
15 Users can upload their surfaces to the web application to calculate things like the fractional contact area, how much actual contact there is as a function of load. They can calculate load-versus-displacement curves for rough contacting surfaces and calculate properties such as contact geometry. This information can be used to determine where a leaking seal is contacting and where it’s not. Users can look at contact pressure to see if a seal is yielding somewhere, or whether the surface is being displaced and forming gaps. They can zoom in on all of the images they generate to examine them in different ways. They also can look at distribution functions to determine, for instance, what fraction of a surface has exceeded its yield point and what fraction is still plastic.
Having one platform that can calculate all of these things facilitates usage for people who don’t want to run their own calculations. And all of the software that runs the web application is open-source Python code, so intermediate users who don’t want to use a “black box” but also don’t want to create their own models from scratch can download the code and run the calculations and modify the code on their own.
In the end, how do you determine the “right” roughness for a particular application? The key approaches include measuring at multiple scales, using scale-dependent metrics and leveraging the science of the problem in your favor.
REFERENCES
1.
Brunetti, V., et al. (2010), “Neurons sense nanoscale roughness with nanometer sensitivity,”
PNAS, 107 (14), pp. 6264-6269. Available at
https://doi.org/10.1073/pnas.0914456107.
2.
Hallab, N.J., Bundy, K.J., O’Connor, K., Moses, R.L. and Jacobs, J.J. (2001), “Evaluation of metallic and polymeric biomaterial surface energy and surface roughness characteristics for directed cell adhesion,”
Tissue Eng., 7 (1), pp. 55-21. Available at
https://doi.org/10.1089/107632700300003297.
3.
Samavedi, S., Whittington, A.R. and Goldstein, A.S. (2013), “Calcium phosphate ceramics in bone tissue engineering: a review of properties and their influence on cell behavior,”
Acta Biomater. 9 (9), pp. 8037-8045. Available at
https://doi.org/10.1016/j.actbio.2013.06.014.
4.
Khanal, S., et al. (2018), “Characterization of small-scale surface topography using transmission electron microscopy,”
Surface Topography: Metrology and Properties, 6 (4), 045004. Available at
https://doi.org/10.1088/2051-672X/aae5b3.
5.
Jacobs, T., Junge, T. and Pastewka. L. (2017), “Quantitative characterization of surface topography using spectral analysis,”
Surface Topography: Metrology and Properties, 5 (1), 01300. Available at
https://doi.org/10.1088/2051-672X/aa51f8.
6.
Gujrati, A., et al. (2018), “Combining TEM, AFM, and profilometry for quantitative topography characterization across all scales,”
ACS Applied Materials & Interfaces, 10 (34), pp. 29169-29178. Available at
https://doi.org/10.1021/acsami.8b09899.
7.
Gujrati, A., et al. (2021), “Comprehensive topography characterization of polycrystalline diamond coatings,”
Surface Topography: Metrology and Properties, 9 (1), 01400. Available at
https://doi.org/10.1088/2051-672X/abe71f.
8.
Jacobs, T., Pastewka, L., et al. (2022), “Surface topography as a material parameter,”
MRS Bulletin, 47, pp. 1205-1210. Available at
https://doi.org/10.1557/s43577-022-00465-5.
9.
Dalvi, S., Gujrati, A., et al. (2019), “Linking energy loss in soft adhesion to surface roughness,”
PNAS, 116 (51), pp. 25484-25490. Available at
https://doi.org/10.1073/pnas.1913126116.
10.
Jackson, R.L. and Streator, J.L. (2006), “A multi-scale model for contact between rough surfaces,”
Wear, 261 (11-12), pp. 1337-1347. Available at
https://doi.org/10.1016/j.wear.2006.03.015.
11.
Thimons, L.A., et al. (2021), “Hard-material adhesion: Which scales of roughness matter?,”
Experimental Mechanics, 61, pp. 1109-1120. Available at
https://doi.org/10.1007/s11340-021-00733-6.
12.
Ding, R., et al. (2021), “Going beyond traditional roughness metrics for floor tiles: Measuring topography down to the nanoscale,”
Tribology Letters, 69, 92. Available at
https://doi.org/10.1007/s11249-021-01460-8.
13.
Ding, R., et al. (2022), “Surface area and local curvature: Why roughness improves the bioactivity of neural implants,”
Langmuir, 38 (24), pp. 7512-7521. Available at
https://doi.org/10.1021/acs.langmuir.2c00473.
14.
Röttger, M.C., et al. (2022), “Contact.engineering—Create, analyze and publish digital surface twins from topography measurements across many scales,”
Surface Topography: Metrology and Properties, 10 (3), 035032. Available at
https://doi.org/10.1088/2051-672X/ac860a.
15.
Gujrati, A., Khanal, S.R., Pastewka, L. and Jacobs, T.D.B. (2022), contact.engineering. Ultrananocrystalline diamond (UNCD) (Version 2). Available at
https://doi.org/10.57703/ce-5cz7a.
Nancy McGuire is a freelance writer based in Albuquerque, N.M. You can contact her at nmcguire@wordchemist.com.