Meet the Presenter
This article is based on a webinar presented by STLE Education on Oct. 18, 2022. Sustainability in the Value Chain of Lubricants - Challenges and Pitfalls is available at www.stle.org: $39 to STLE members, $59 for all others.
STLE member Inga Herrmann is currently head of the lubricants department at the Verband Schmierstoff-Industrie e.V. (VSI, German Lubricant Manufacturers Association) in Hamburg, Germany.
For more than two decades, she worked for Shell Deutschland GmbH as a technical key account manager for industrial lubricants. In her years at Shell, she was responsible for evaluating and winning new business with OEMs and key customers in various segments of industrial lubrication with a focus on the grease business.
In 2020 Herrmann joined the VSI where she is mainly responsible for establishing a European sustainability standard for the lubricants industry in collaboration with other associations and industrial institutions as well as other lubricant topics such as standardization of highest importance for member companies.
In 2018 Herrmann joined the Earthwatch Expedition “climate change in northern ecosystems” in Churchill, Manitoba, in the western Hudson Bay region of Canada as a volunteer where she supported the scientific research at the Churchill Northern Studies Centre. This is a long-term research program to understand climate-related changes in northern ecosystems.
Herrmann is a member of the Union of the European Lubricants Industry (UEIL) Sustainability Committee in Europe and member of the Asian Lubricants Industry Association (ALIA) Sustainability Subcommittee.
You can contact her at inga.herrmann@vsi-schmierstoffe.de.

Inga Herrmann
KEY CONCEPTS
•
Carbon footprint calculations that can be compared across products and manufacturers require agreement on definitions and methodologies, documentation and validation.
•
Limited data availability and wide variations in feedstocks and product types introduce complications into carbon footprint calculations.
•
Achieving a meaningful global standard requires global cooperation and alignment along all parts of the value chain.
Responding to climate change requires everyone’s participation, including the lubricant industry. However, a transformation in our industrial society is needed if we are to reduce greenhouse gas emissions and other pollutants in a significant way. In order to build sustainable industrial practices, we need to understand the main factors influencing climate change. Here, we focus on quantifying carbon dioxide (CO
2) and carbon footprints as a necessary metric for setting goals and measuring progress.
This article is based on an STLE webinar titled Sustainability in the Value Chain of Lubricants - Challenges and Pitfalls, presented by STLE member Inga Herrmann, head of the lubricant department of Verband Schmierstoff-Industrie e.V. (German Lubricant Manufacturers Association). See Meet the Presenter for more information.
Today, we use fossil materials (e.g., coal, petroleum and natural gas) on a large scale to provide energy and as sources of carbon for many chemical processes. If we switch from fossil carbon sources to renewable energies, we reduce or eliminate climate- changing carbon and CO
2 emissions, but industry loses carbon as a source for many raw materials. Our challenge now is to obtain the carbon needed for products and processes from sustainable sources to create a true carbon cycle.
Creating sustainability on a large scale will likely require a combination of several approaches
(see Figure 1). Recycled carbon-containing materials and biomass are two potential alternative sources of carbon. Another potential source is air capture, in which CO
2 is taken from the atmosphere and is converted into high-value chemical products.
 Figure 1. Obtaining carbon needed for energy and for chemical processes can be made more sustainable. Figure courtesy of Lubetrading GmbH.
Increasingly, governments and international organizations are establishing targets and measuring progress toward two goals: climate neutrality and decarbonization. Lubricant manufacturers are feeling the effects along the entire length of their supply chains. Suppliers are changing their raw materials and processes by substituting biological and sustainable components for fossil carbon sources, which also influences the products and processes of the lubricant marketers. Customers and OEMs increasingly ask for climate-neutral and decarbonized products as well. What’s more, the capital market now prioritizes investing only in companies that implement sustainability goals. Thus, measuring and managing the lubricant industry’s carbon footprint becomes critical to reducing CO
2 emissions.
When companies begin their sustainability efforts, they often carry out sustainability metrics to define time-critical fields of action and to find ways of working together with their colleagues upstream and downstream in the supply chain. Collaboration along the length of various supply chains is key to success in large-scale, long-term sustainability efforts, as outlined in the U.N.’s 17 Sustainability Goals.
1
Feedprints, footprints, handprints and other terminology
Calculating a corporation’s carbon footprint begins with examining operations from factory gate to factory gate for each of the corporation’s worldwide locations and subsidiaries. It also requires identifying boundaries between the steps in the production, use and disposal chain for each product.
The Greenhouse Gas Protocol Corporate Standard
2 for calculating a corporate carbon footprint is equivalent to the ISO 14064 standard,
3 and it encompasses three scopes. Scope 1 involves carbon emitted directly as a result of running machinery, driving vehicles, heating buildings and other onsite operations. Scope 2 covers indirect (offsite) emissions created during the production of energy that an organization buys. Scope 3 emissions, which often account for more than 70% of a company’s footprint, are produced by suppliers that make products that the company uses or as a result of customers using products that the company sells.
4
Extraction and production of raw materials constitutes the “cradle” that starts a supply chain, and the resulting carbon emissions are referred to as the “feedprint”
(see Figure 2). The lubricant manufacturer buys these raw materials or lubricant components made from these materials and brings them into the factory (the first “gate” in a gate-to-gate calculation). The manufacturer then makes finished lubricant products that it sells to its customers (the second “gate”). The carbon emissions involved in getting this product to the point of sale is the company’s carbon “footprint.” A cradle-to-gate calculation uses the total of the feedprint, the footprint and the utilities used in making the finished lubricant.
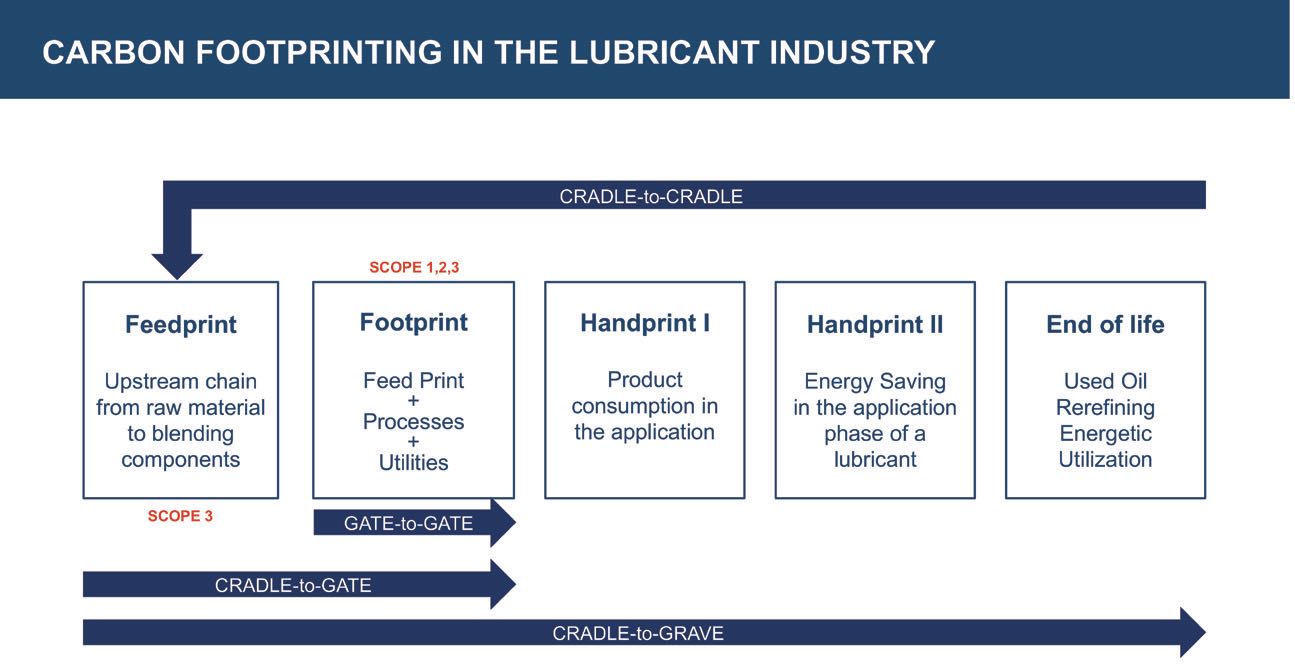 Figure 2. Definitions for various segments of an industrial supply chain. Figure courtesy of Verband Schmierstoff-Industrie e.V. (German Lubricant Manufacturers Association).
The lubricant manufacturer can evaluate the products it sells using benchmarks that represent a typical life cycle analysis, but ultimately, the customer is responsible for selecting and applying their lubricants. Customers buy finished lubricant products, which they use to reduce friction, wear and corrosion in their machinery. They look for products that lengthen oil drain intervals and reduce evaporation losses. Each of these factors reduces the lubricant’s “handprint.”
The point where a customer disposes of a used lubricant is the “grave” in a cradle- to-grave calculation. Increasingly, however, stakeholders in the lubricants industry and their customers and suppliers are advocating for a “circular economy” approach. Once a lubricant reaches the end of its service life, it can be collected and regenerated or reprocessed into new base oils or feedstocks for the production of new lubricants—a cradle-to-cradle approach. This approach produces significant, measurable reductions in CO
2 emissions to the atmosphere compared to virgin base oils or conventional base oils. Some waste oils with a high additive content cannot be regenerated, but they can be incinerated to generate heat rather than being discarded.
Many sources in the upstream chain
In the lubricant manufacturing industry, the upstream chain is the starting point in calculating the carbon footprint of a finished lubricant
(see Figure 3). About 90% of CO
2 emissions in this industry come from the raw materials: base oils and additives. Base oils are produced from crude oils that originate from all over the world and take various modes of transportation to arrive at the lubricant factory’s gate. Heavy crude comes from Venezuela, high-flare crude from the Middle East and crude with high methane slip (methane released into the atmosphere) from Siberia. Carbon footprint estimates for crude oil can vary by a factor of more than 600%.
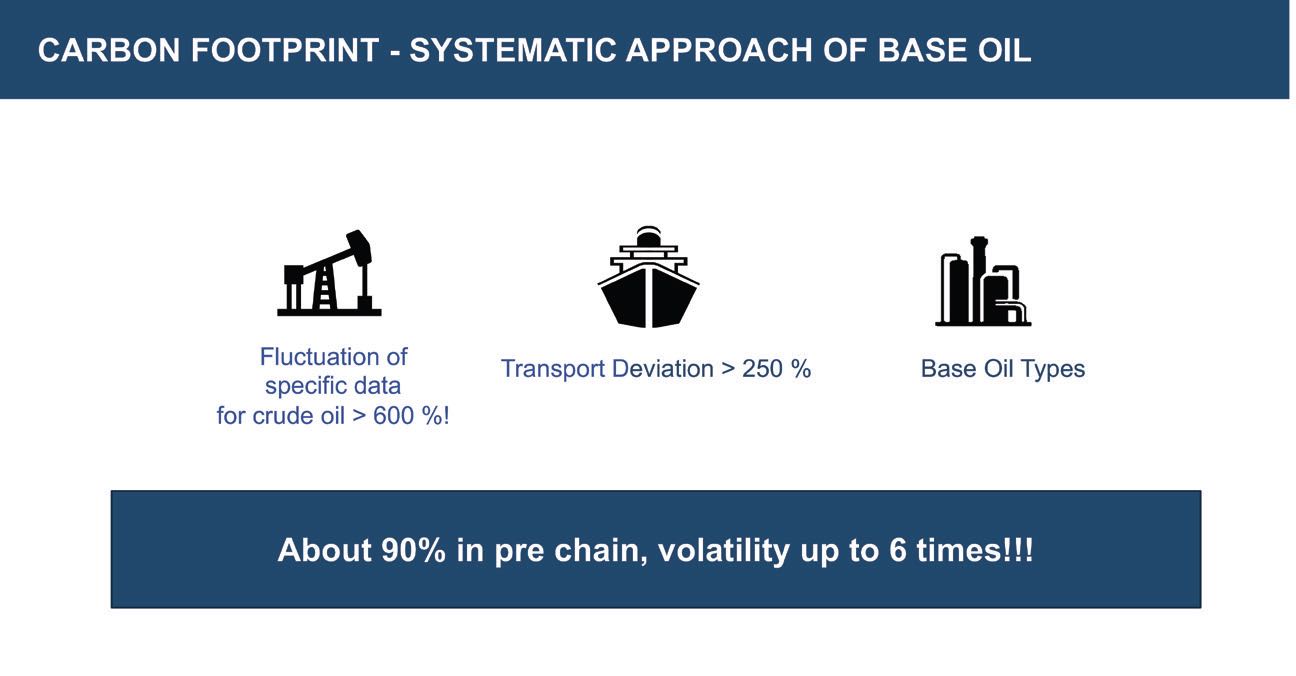 Figure 3. Carbon footprint calculations for base oils are complicated by wide variations in feedstock sources, transportation and base oil types. Figure courtesy of Lubetrading GmbH.
For the purposes of carbon footprint calculations, one approach is to exclude extreme CO
2 emitters such as oil sands
5 if they are not relevant for base oil production, and to take an average of the remaining sources. Because there is no standard for crude oil, a global average parameter can be determined for each single base oil type using these average values. However, a realistic carbon footprint quantification requires taking into account the uncertainties introduced by the large range of estimated values and building a safety margin into any decisions derived from these results.
The same principle applies to transportation of base oils from different parts of the world by ships, pipelines and other means, because carbon footprint contributions from these methods of transportation can vary by more than 250%. To determine a specific base oil figure or a specific carbon footprint of a single base oil type per refinery, we need to calculate a realistic average value based on the mass flow (more on this later) and adding the utilities and the energy involved.
The high degrees of variability in base oil production and transportation demonstrate how uncertain the database is and how time consuming it would be to generate reliable data for each situation. The situation for additives is even more complicated. Most additive suppliers are chemical companies with highly complex and diverse processes and products. For example, the same molecule can be produced from different sources or by different processes. Further, suppliers themselves decide on processes and products. They decide on and prioritize which sustainability criteria they will apply, and this in turn influences the lubricant’s value chain and the lubricant’s processes. The secrecy of the additive supplier’s intellectual property plays a central role, and this makes a detailed calculation and providing of individual data much more complicated.
This combination of feedstock variability and incomplete information greatly complicates the search for the right methodology of calculating a product carbon footprint of a finished lubricant.
Challenges and pitfalls of calculating carbon footprints
Lubricants often have a complex value chain, and it is essential to cover all relevant requirements of this value chain when setting up a calculation scheme and transforming this into a pragmatic approach. This effort requires cooperation and collaboration among all stakeholders across the value chain.
Industries in general are beginning to collect the necessary primary data, but these data are often not available for lubricant components. Because it’s very difficult to get specific values for crude oil or base oil, we need to work with proxy data or with estimates for the time being and to work on getting reliable primary data to generate more accurate carbon footprints in the future.
The lack of a common methodology and standard values makes it difficult to calculate the product carbon footprint of a finished lubricant along the whole value chain and to compare results for various products. Many companies are starting to provide data, but there is no transparency on which standards or methods have been used to calculate and verify those data. How do they arrive at these data, and how do you make sure that you can compare them? Data verification is essential to ensure that data are objective, reliable, transparent and comparable.
Global standards already in place, like the greenhouse gas protocol or the ISO standards, are not very specific, and they offer a great scope of interpretation. These standards can set the frame, but they cannot reflect the specific characteristics of a lubricant’s value chain. Also, they are not applicable specifically for finished lubricants because they apply to all products in different industry segments.
The transition to more sustainable lubricants requires comparing the carbon footprints of various products. This, in turn, requires a common, consistent methodology, with information provided at appropriate intervals to help track performance
(see Figure 4). Developing such a methodology for carbon footprint calculations for finished lubricants involves addressing several issues.
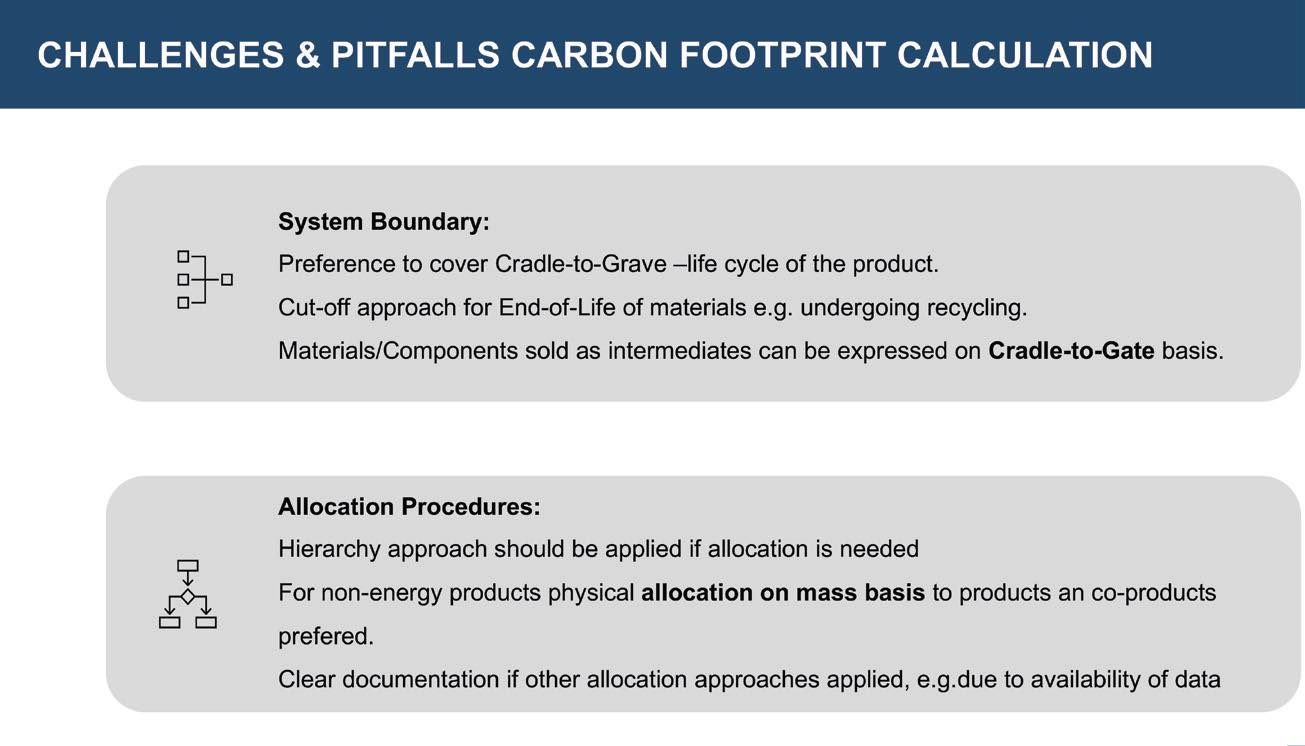
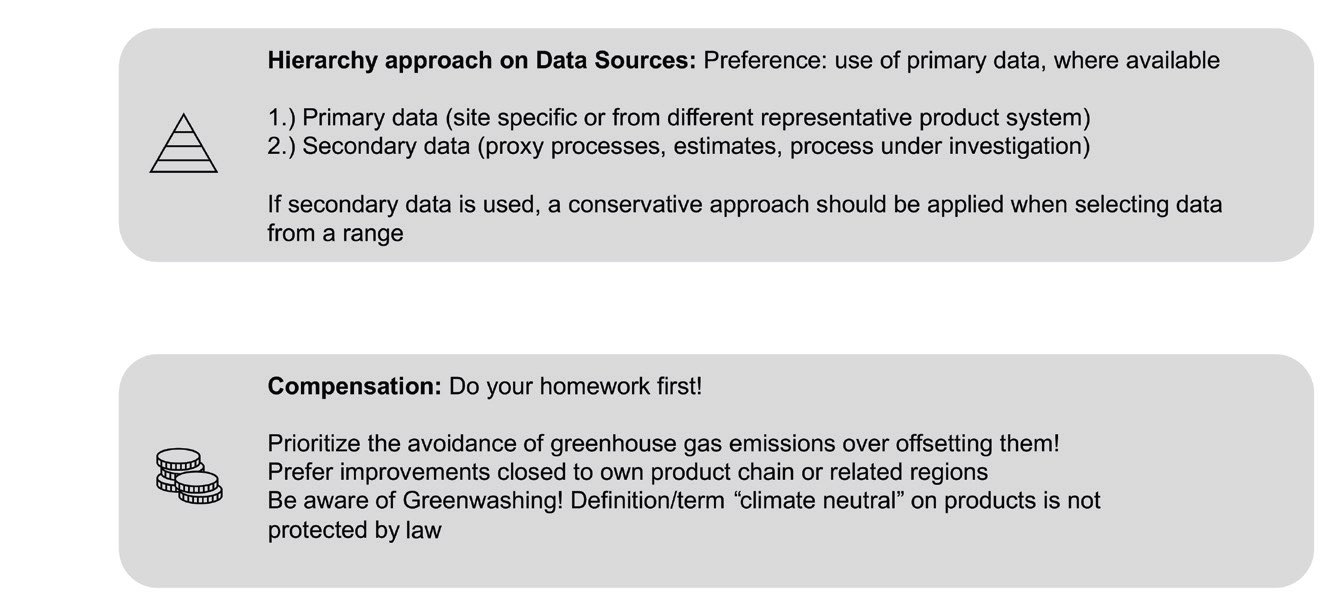 Figure 4. Consistent methodologies are required for calculating carbon footprints that can be compared with each other. Figure courtesy of Verband Schmierstoff-Industrie e.V. (German Lubricant Manufacturers Association).
Boundaries, allocations and hierarchies
One important issue is the definition of the system boundary. Currently, methodologies exist that cover the cradle-to-grave approach—from the product’s feedprint to end of life—which requires constructing a description of the product’s life cycle. However, lubricant materials and components are often sold as intermediates, which requires a cradle-to-gate approach. This requires establishing boundaries that define where the gates are and what constitutes the product’s end of life. Clearly defined boundaries prevent double counting of CO
2 emission reductions from, say, a lubricant manufacturer and the OEM they supply.
The cradle-to-gate approach only takes into account the emission reductions associated with the lubricant manufacturer’s processes, and not the potentially much greater contributions that these lubricants make to emission reductions resulting from the customer’s use of the lubricants. Because the lubricant manufacturer does not dictate how the customer uses the product, they cannot claim the credit for these emission reductions. A lubricant manufacturer can make recommendations to their customers on how to use their products in the most sustainable way, but ultimately the end-user bears the responsibility for their application of the product. Thus, the manufacturer’s contribution to the carbon footprint essentially ends when the product leaves the factory gate.
Another relevant aspect is the allocation procedure. Allocation approaches divide energy and emissions burdens among co-products based on their mass, energy or market value shares.
6 Lubricants are non-energy products (i.e., they are not used as sources of energy), so physical allocation on a mass basis is preferred. If another allocation approach is applied, it must be clearly documented according to the ISO hierarchy described in their 14040, 14044 and 14067 standards.
7
A third aspect is a hierarchical approach to data sources. Primary data is the best option where it’s available, but primary data are often site-specific, or they come from different representative product systems, so it’s very difficult to align primary data from different sources. Secondary data (proxies, estimates and processes under investigation) require a conservative approach that recognizes the greater margin of uncertainty. As more and more reliable and realistic primary data become available, calculations can be revised to reflect a greater degree of precision.
Compensatory factors (reductions in carbon footprint that counterbalance some fraction of the carbon emissions produced by a process) also come into play. However, including these factors requires doing your homework to ensure that the claimed benefits are based on real improvements rather than “greenwashing”—glossing over environmentally unsound practices or using vague, unverifiable terms like “climate neutral,” “ecofriendly” or “sustainable.” For example, avoiding greenhouse gas emissions should be prioritized over offsetting emissions. Reducing emissions from your own processes and close to your own product chain or related region should be the highest priority. Once these improvements have been made, then compensating factors can be taken into account, but only then.
How can the lubricant industry calculate its carbon footprint?
If the lubricant industry is to calculate a meaningful carbon footprint, there must be a harmonized, agreed-upon industry approach that is aligned through all stakeholders of the value chain
(see Figure 5). The approach should begin by building upon international standards before going into details.
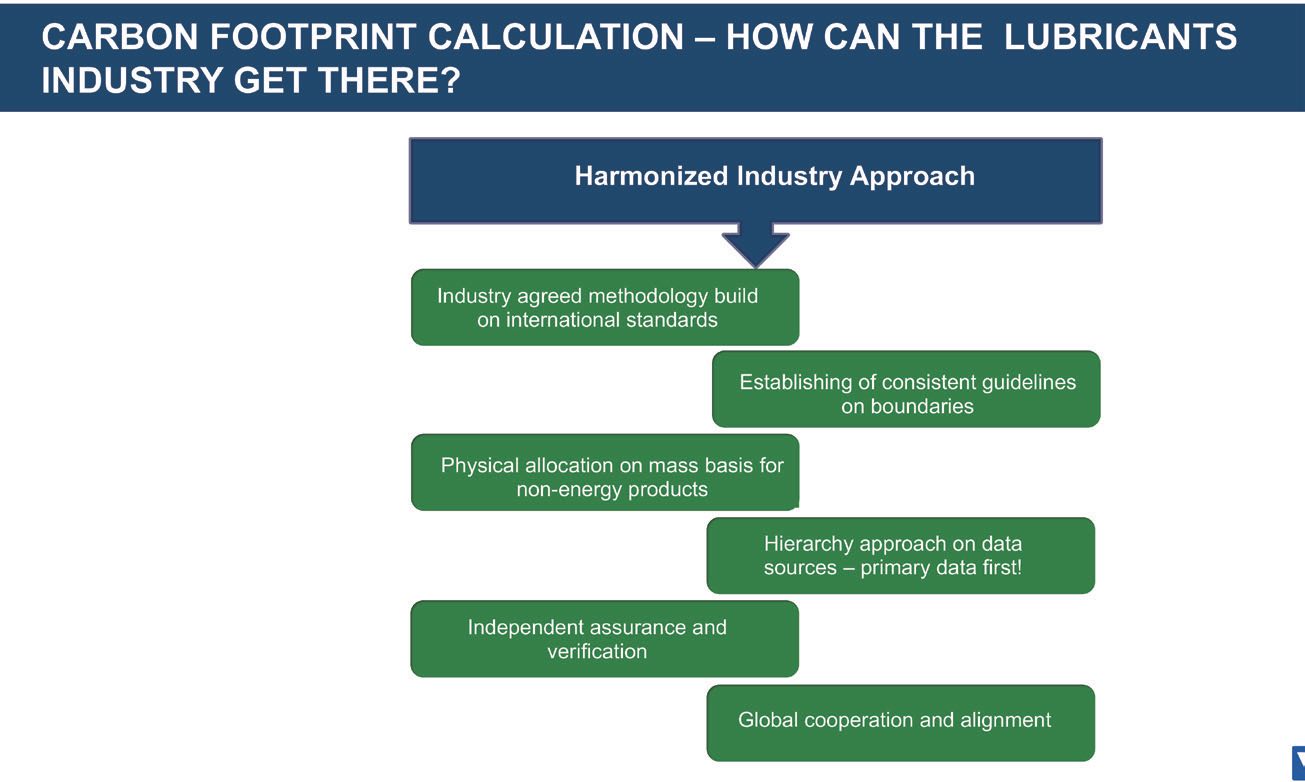 Figure 5. A harmonized, agreed-upon industry approach must be aligned through all the stakeholders of the value chain. Figure courtesy of Verband Schmierstoff-Industrie e.V. (German Lubricant Manufacturers Association).
It’s very important to apply the complex, specific requirements of the lubricant industry within this methodology and to establish consistent guidelines on boundaries (cradle-to-gate or cradle-to-grave).
The allocation mode should be defined so that the preference is for physical allocation on a mass basis for non-energy products, with documentation required for other allocation methods. Primary data must be first in the hierarchy of data sources. If there are no primary data available, secondary data may be used with a sufficient safety margin.
Independent assurance and verification are important. The best methodology is worthless without a neutral, independent monitor to ensure that the calculations follow rules of the stated methodology. It’s also important to create a level playing field by establishing a neutral, precompetitive platform for the data on which carbon footprint calculations are based and evaluated and to ensure that everyone has the same access to these data.
No single company can accomplish this as a solo effort. Achieving a meaningful global standard requires global cooperation and alignment along all parts of the value chain. Acceptance of a methodology across the board requires interaction and harmonization among partners, suppliers, OEMs and customers, as well as legal authorities and non-governmental organizations (NGOs). The payoff is that establishing a common basis for calculating carbon footprints enables better decisions for the energy transition.
At present, there is no established harmonized methodology for calculating a product carbon footprint, in part because of the difficulty that intellectual property protection presents to gathering data. However, various collaborative efforts are making progress on methodologies for specific products
(see Figure 6). For example, Europe’s Together for Sustainability initiative, an industrial consortium driven by the chemical industry, recently launched an open-source guideline for chemical product carbon footprint calculations.
8 Catena-X, an auto industry group, is working to enable the digital flow of open, secure data across the entire automotive supply chain.
9 The World Business Council for Sustainable Development
10 is coordinating with other carbon footprint efforts to address the quality and comparability of emissions data and to set consistent rules across various industry sectors for calculating and reporting product carbon footprints.
11 These are just three examples of organizations around the world who are working to tackle this challenge.
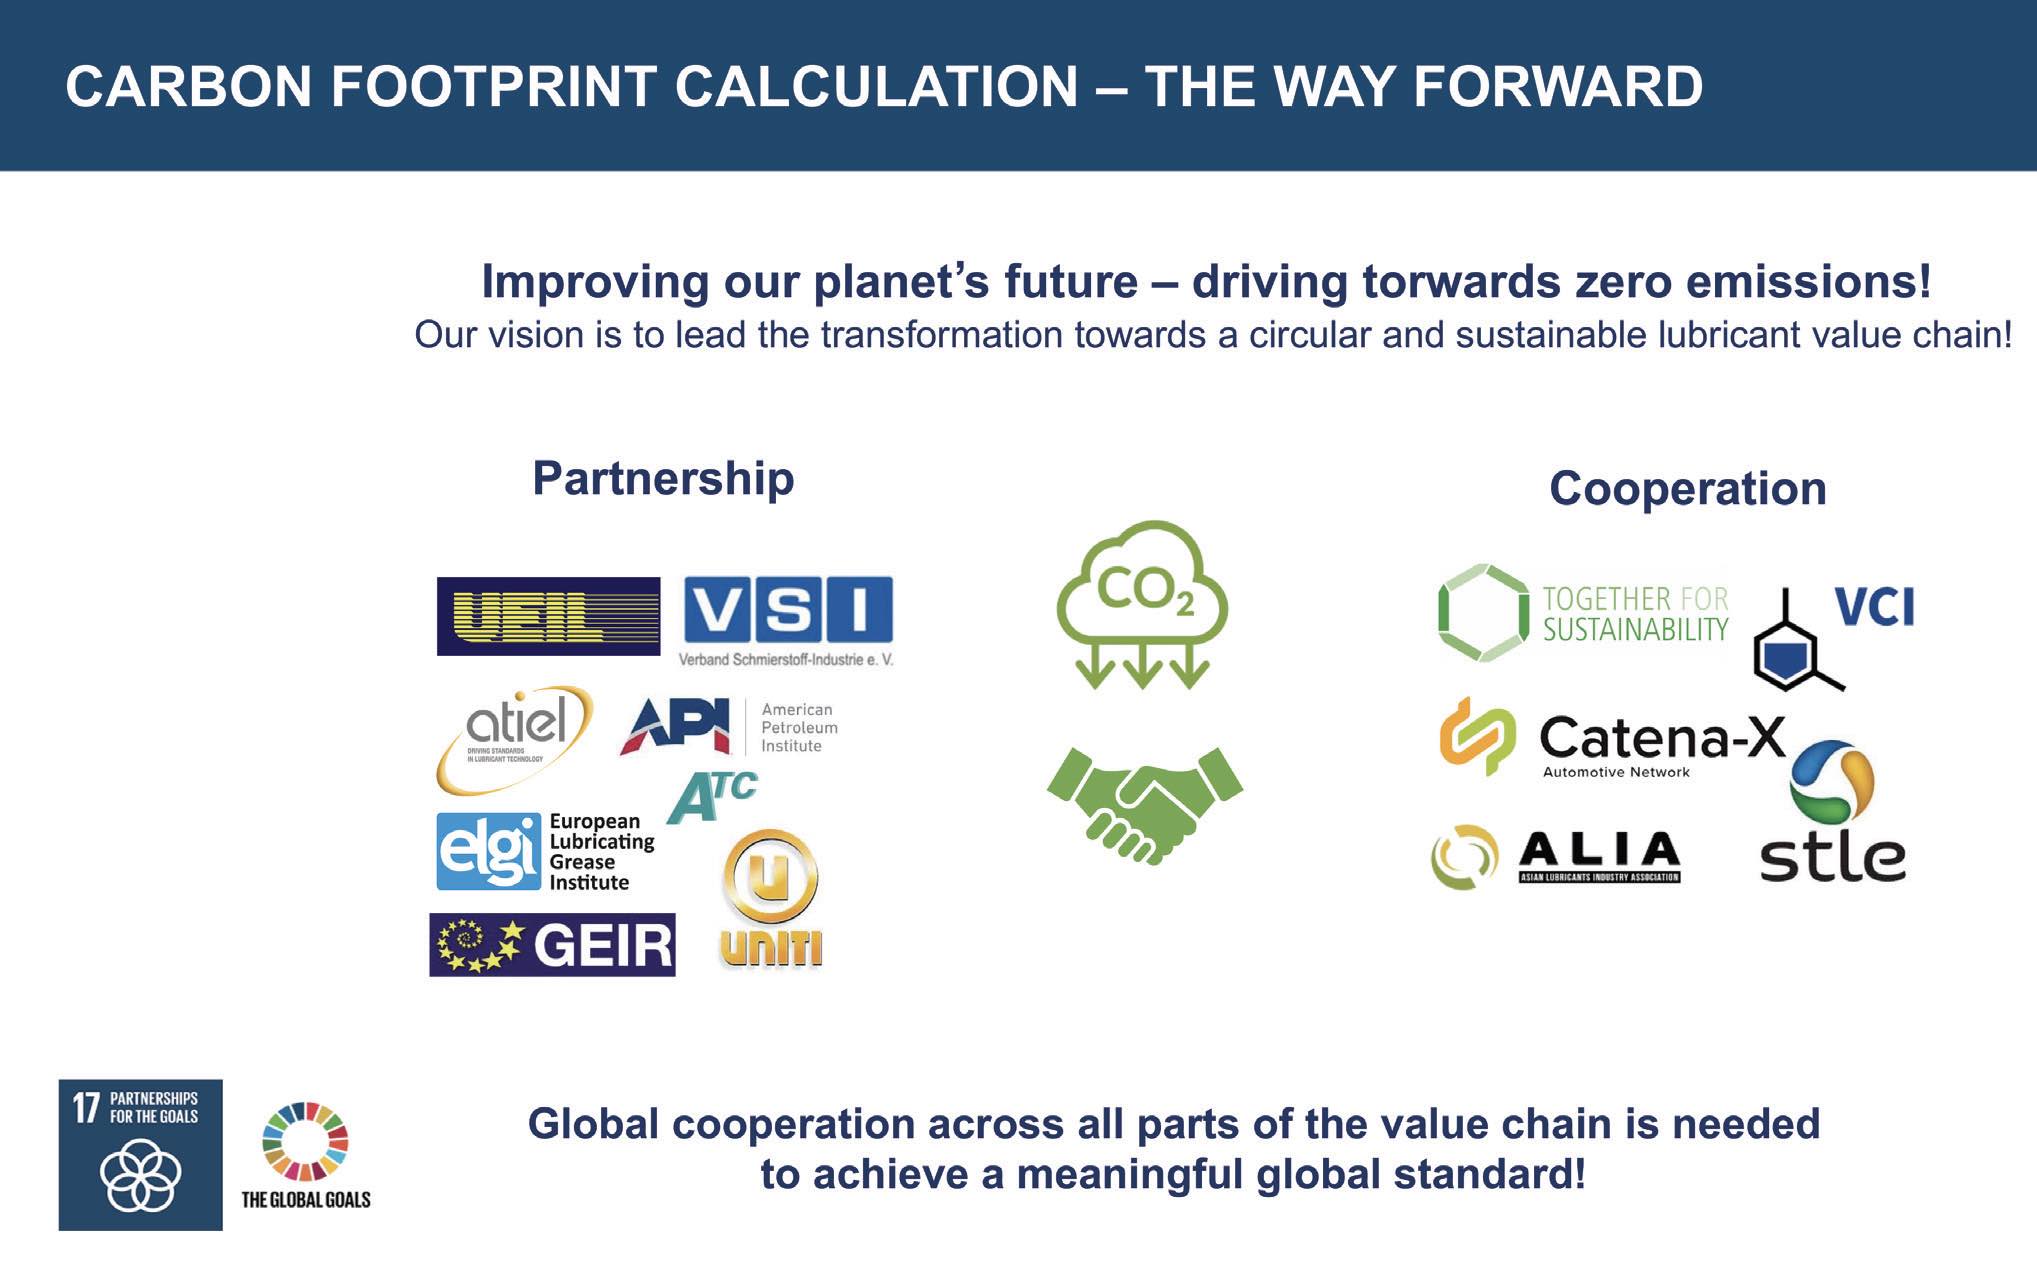 Figure 6. Various collaborative efforts are making progress on carbon footprint methodologies for specific products. Figure courtesy of Verband Schmierstoff-Industrie e.V. (German Lubricant Manufacturers Association).
Many individual companies have already begun their own sustainability journeys. In addition, they have joined collaborative efforts with other companies and organizations, in recognition of the interdependency among companies along the supply chain on the quality of each other’s data. We look forward to working with STLE members to develop transparent and consistent global methodologies to give reliable data. As Larry Fink, CEO of American multinational investment management corporation Blackrock, says, “Every company and every industry will be transformed by the transition to a net zero world. The question is, will you lead, or will you be led?”
REFERENCES
1.
https://sdgs.un.org/goals
2.
https://ghgprotocol.org/corporate-standard
3.
https://webstore.ansi.org/standards/iso/iso14064greenhousegasespackage
4.
www.weforum.org/agenda/2022/09/scope-emissions-climate-greenhouse-business/
5.
www.pembina.org/blog/real-ghg-trend-oilsands
6.
https://nap.nationalacademies.org/read/25232/chapter/10#171
7.
https://pre-sustainability.com/articles/lca-standards-and-guidelines/
8.
www.tfs-initiative.com/
9.
https://catena-x.net/en
10.
www.wbcsd.org/
11.
https://cen.acs.org/business/informatics/quest-data-products-carbon-footprint/100/i40
Nancy McGuire is a freelance writer based in Albuquerque, N.M. You can contact her at nmcguire@wordchemist.com.