Meet the Presenter
This article is based on a webinar presented by STLE Education on Aug. 3, 2022. The Evolution of Battery Technology for the Emerging Global EV Market is available at www.stle.org: $39 to STLE members, $59 for all others.
Ron Turi is a battery engineer who owns and operates Element 3 Battery Venture, LLC, a small, but well-equipped development lab centered on lithium battery design that provides contract services for battery end-users, cell makers and materials suppliers to the battery industry. Turi is a chemical engineer with 30 years of experience in the lithium-ion battery industry, starting with electrode coating and moving to cell and to battery level development/design. Ron is engaged in projects for startup companies and larger companies involved in multiple emerging battery technologies with a focus on EV applications.
You can reach him at ronturi@e3bv.com.

Ron Turi
KEY CONCEPTS
•
EV battery components continue to evolve.
•
High growth is projected for passenger EV battery cells.
•
Modeling that incorporates the development of EV battery component technologies helps predict growth dynamics.
The phenomenal rate of growth of lithium- ion battery (LIB) cell manufacturing to support the electric vehicle (EV) market presents expanding opportunities for a broad cross section of industry suppliers and technology developers. This article covers trends and motivation behind the evolving chemical and engineering specialties that are emerging in the EV battery industry.
This article is based on an STLE webinar titled The Evolution of Battery Technology for the Emerging Global EV Market, presented by Ron Turi, battery engineer who owns and operates Element 3 Battery Venture, LLC. See Meet the Presenter for more information.
The commitment made by just about every global auto OEM to change from conventional internal combustion engine (ICE) passenger vehicles to EVs presents enormous growth opportunities for auto industry suppliers. This is abundantly clear in the new regional markets in North America and Europe, where tax credit incentives underwrite plant construction and capital equipment as well as production of EV cells and batteries plus critical minerals. Auto OEMs can choose proven battery technologies that secure the supply of EV batteries that provide an average 275 miles range and require an hour to charge. On the other hand, competition can motivate auto OEMs to develop EV batteries with advanced technologies that provide higher driving range and faster charging. This article focuses on the latter by examining the trends in technology innovation and projecting the impact on the EV battery industry and its supply chain.
Trends
The EV battery industry and market is very dynamic.
•
Conventional auto OEMs are converting manufacturing and operational assets from ICE to EV before 2035 and, in most cases, before 2030. Competition for the nascent market is fierce as each auto OEM seeks to establish EV market share.
•
The supply chain for EV batteries is tight—from lithium (Li) and nickel (Ni) mineral resources to EV grade cells. Auto OEMs must work with as many EV cell manufacturers as possible if there is a chance to fulfill reservations for hundreds of thousands of EV model orders.
•
Meanwhile, auto OEMs seek to control the EV battery supply chain— manufacturing EV cells in-house and securing offtake agreements for minerals and other key cell components. At the same time, cell makers also are moving to secure materials and contracts with auto OEMs to prevent being cut out of the supply chain.
•
There is a rush to build new LIB gigafactories, accelerated by the trend for regionalizing the EV ecosystem and EV battery manufacturing, with local supply chain development in Europe and North America—the latter fostered by government tax credit and matching grant programs such as the Inflation Reduction Act and the Bipartisan Infrastructure Law, respectively.
•
Auto OEMs have taken a dual approach to EV battery technology—on the one hand using proven LIB technology to guarantee stable EV battery production for present sales, while also displaying an unprecedented willingness to disrupt existing processes with advanced product and manufacturing technologies, even switching battery design and chemistries to gain competitive advantages. At one point, every passing month looked different.
•
There are many examples of technologies implemented that appear to have been adopted regarding EV battery design and EV manufacturing processes as well as the EV skateboard/ EV drive system.
EV grade lithium-ion (LI) cells are complex. The shape or form factor of the cell can vary as can the cell dimensions and electrode chemistries. In every case, packing electrodes tightly and having cells close together is ideal to get the highest energy density in Watt-hours per liter available for given cell design. In EV platforms, there is a limited space claim, which is often defined by the dimensions between wheels, between axles and a certain allocation to battery height. At the same time, all batteries generate heat, which must be dissipated by a thermal management system—a function that requires some of the space allocated to the EV battery. Battery engineers seek design trade-offs that pack as many energy storage cells and cooling elements as will fit into the space claim.
Passenger EV battery cell market size
Most public sources of information on the EV industry and market (Bloomberg New Energy Finance, the International Energy Agency [IEA], U.S. Department of Energy [DOE]) predict a phenomenal growth rate leading to >2,000 GWh of global production by 2030. At minimum this represents a 10-fold growth of the EV cell market from 2021 until 2030, as shown in Table 1. At a nominal $80/kWh, the above prediction for the 2030 EV cell market represents at least $160 billion in global sales.
Table 1. Passenger EV battery cell market size
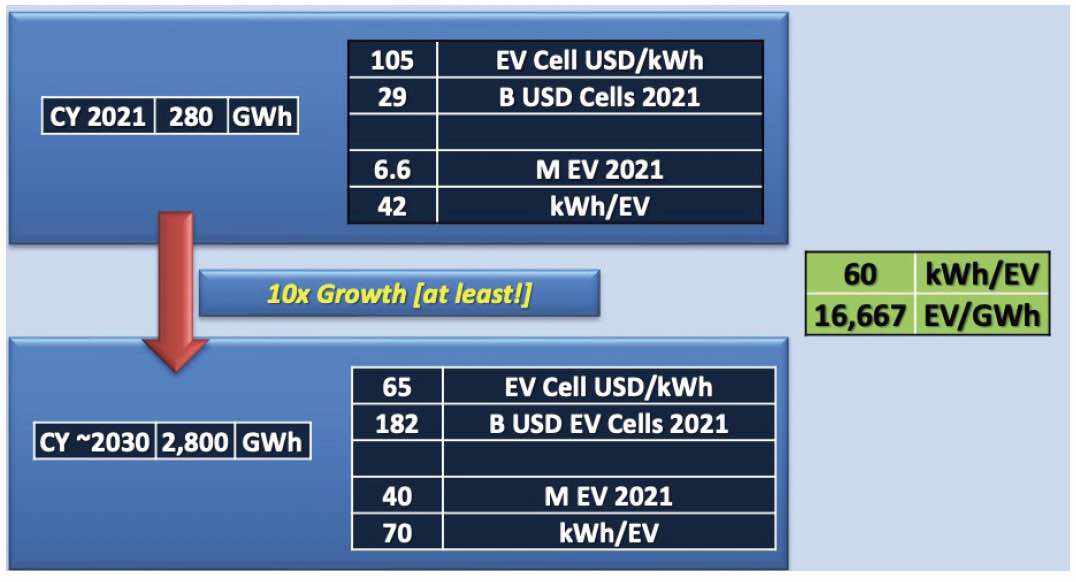
A way to cross check this data is to review the EV penetration rate into the passenger vehicle market. It is estimated that the passenger EV market size was around 6.6 million sold in 2021, with 42 kWh per vehicle. Looking at 2030 data
(see Table 1), the penetration rate is estimated to be at around 40% of the passenger vehicle market, with battery size per EV expected to increase.
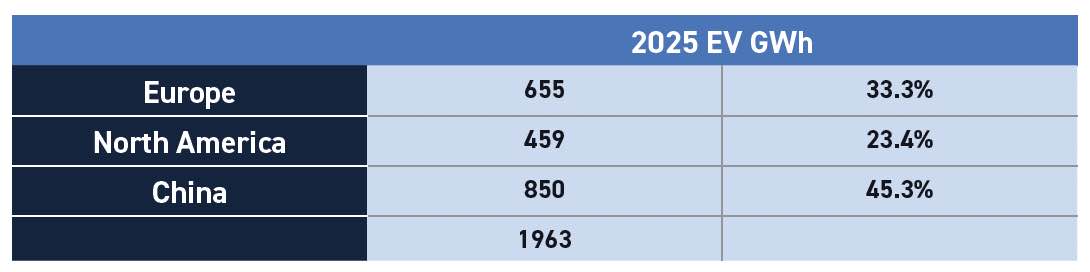
In recent years, industry announcements of planned production capacity of EV cells in terms of GWh installation have exceeded almost all market analysis projections and, in many cases, doubling expectations. Regionally, the highest growth rate is anticipated in North America and Europe. The industry needs to be ready to acquire equipment to build the new plants and establish supply chains to provide the very large demand of raw materials that will be required. Building the planned EV battery capacity implies a regional shift from the dominant 80%-85% of EV batteries are produced in China to a more balanced scenario as early as 2025 toward Europe and North America, as shown in Table 2. Materials for the EV battery production are now dominated by suppliers in China, but regional supply alternatives are developing.
Table 2. Regional market shift
Given the above market outlook, what is a reasonable shape for an annual forecast model of EV batteries production in GWh? To develop an LIB Manufacturing Industry Growth Model
(see Figure 1), obtaining information from a number of different reputable sources is necessary, such as Bloomberg New Energy Finance, McKinsey & Co., DOE, IEA, etc. Since we anticipate a replacement of ICE passenger vehicles with EVs over a period of many years, a sigmoidal model can represent a “smooth step change” in annual EV battery production. The curve began with a gradual climb in the early years as early adopters bought EVs from first movers. The present announcements of increasing EV battery production capacity reflect the “exponential” appearance of the steeper climb of a sigmoidal model. In later years, the sigmoidal curve levels off, reflecting EV saturation as the auto industry transition to EV platforms nears completion. Note the sigmoidal function can be modified. For example, the model in Figure 1 includes a modest estimate of 10% year-over-year growth for the passenger vehicle market, which results in slanting the sigmoidal form instead of moving asymptotically between two horizontal limits. The model can accommodate additional factors to conform with actual data—the EV battery production of the early years are empirically fit into the model.
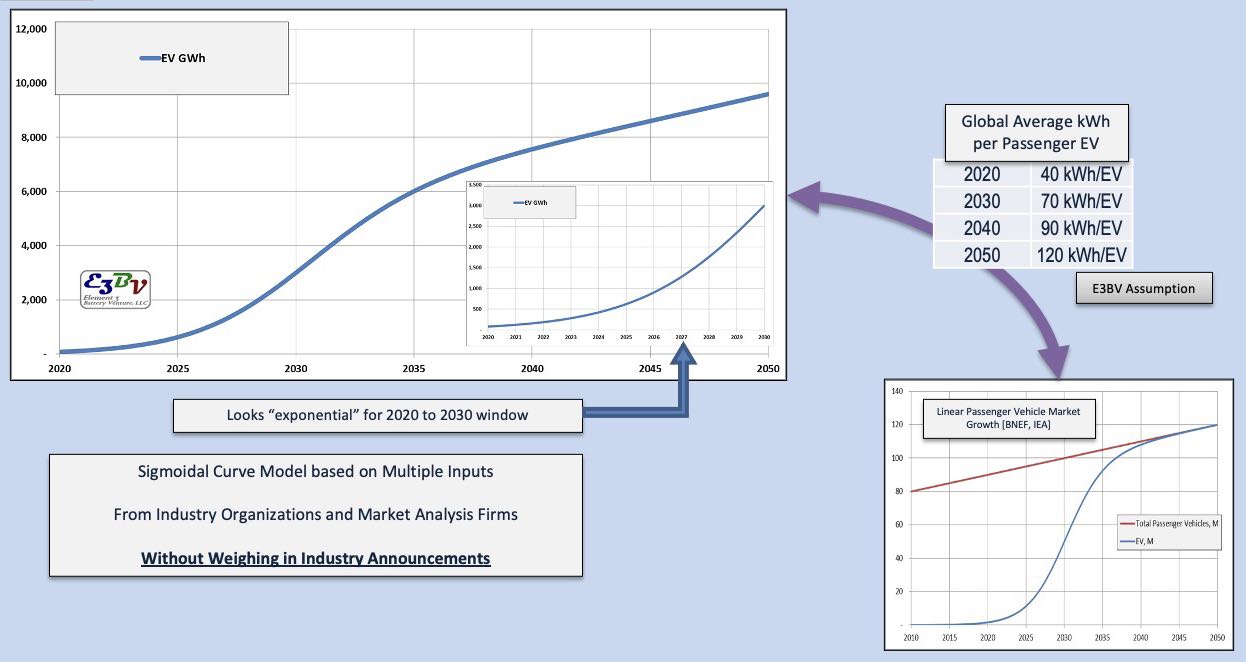 Figure 1. LIB Manufacturing Industry Growth Model, E3BV “compilation.”
It also is important to account for materials used in LIB such as lithium, nickel and graphite so demand for those materials also can be predicted
(see Figure 2). This model is a derivative of the EV battery production model, except that a set of assumptions are superimposed to break out the metals based on forecasts of battery technology evolution and adoption. In this analysis, the focus on cathode active materials (CAM) provides notional modeling of Li and transition metal demand. Many sets of assumptions can be formulated including the effects of supply chain bottle necks. Only a straightforward forecast is shown. It reflects increasing Ni-rich CAM adoption in the coming years toward 2030, followed by manganese (Mn)-rich CAM. These details are some of the major subjects of technology evolution. Higher voltage cells enabled by advanced Mn-rich CAM are positioned to lower cost in a few ways but depend on new technology like solid-state electrolyte or high voltage liquid electrolyte in order to cycle close to 2,000 times as expected by EV auto OEMs.
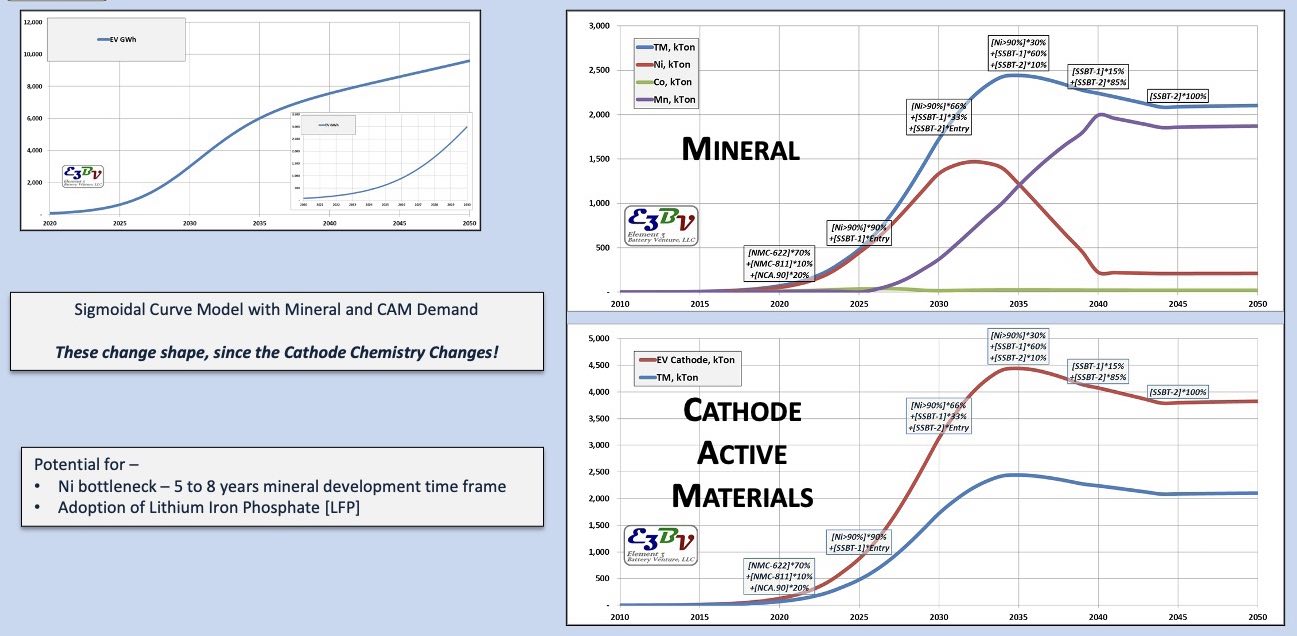 Figure 2. Manufacturing industry growth—effect on supply.
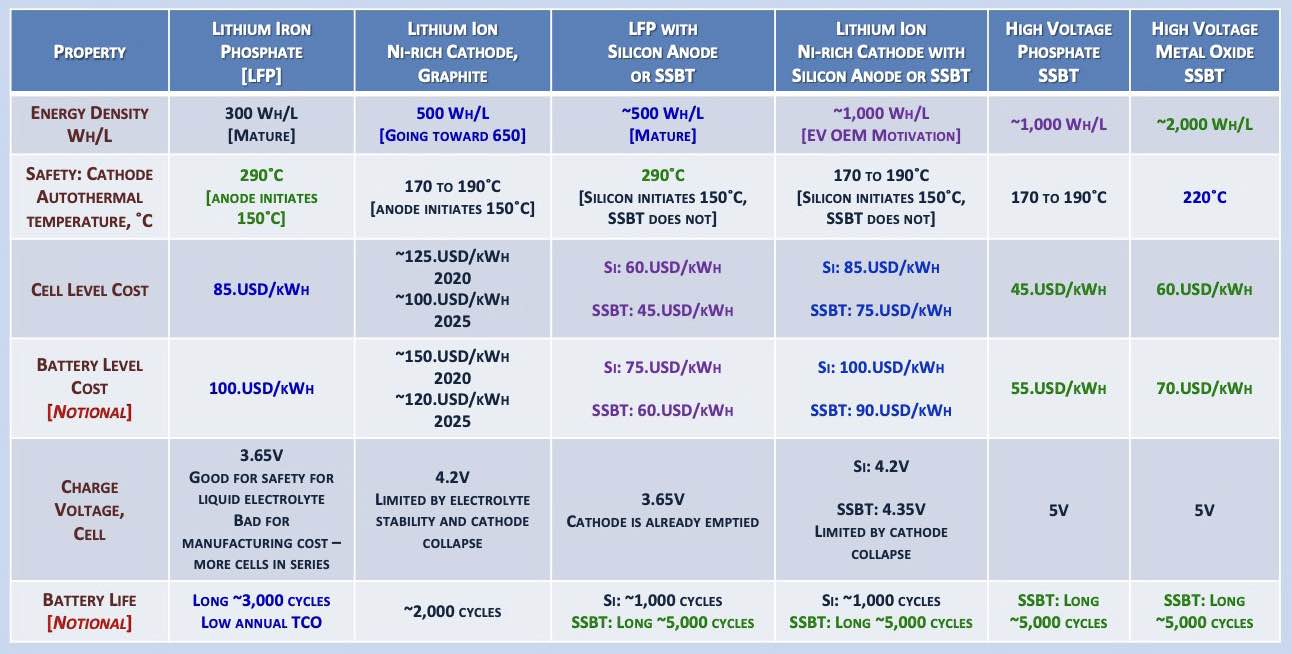
Meanwhile, the full picture that includes new CAM as well as new anode active materials (AAM) continues to evolve and expand with a larger set of technology choices. Table 3 shows an overview of cells with selected combinations of CAM and AAM and the typical performance and safety properties associated with each. Lithium iron phosphate (LFP) cells, for example, are produced predominately in China today, and the CAM is a mature technology that attains close to theoretical specific capacity. Cells with Ni-rich cathode provide the highest energy densities today and are the most popular in EV battery use, and yet require more robust electrolyte systems that enable higher cell voltages in order to reach full theoretical specific capacity. There are solid-state electrolytes and novel electrolyte solvents under development to achieve this goal. There also are new cell combinations with silicon, which results in a decrease in anode thickness. For example, silicon with lithium iron phosphate increases energy density and retains the positive safety attribute of LFP cells. There are even thinner anodes that use lithium metal. When combined with high voltage CAM and solid-state electrolytes, very high energy cells result. At the EV battery level, auto OEMs must balance many considerations: energy density, safety, cost, etc. In addition, these selections have implications on cost effectiveness of cell and battery production processes, which ultimately affects vehicle cost.
Table 3. LFP versus metal oxide cathodes in lithium-ion cells
A typical question arises when analyzing lithium availability—is there going to be enough lithium in the world? The answer is straightforward—yes, there’s enough lithium in the world. Lithium is not rare if to look at its relative abundance compared to silicon, which is the base case in this analysis. Although it might be three years magnitude or so less abundant than silicon, but so is nickel which is four years, and lead which has been used in lead acid batteries for a very long time. Therefore, it is not that lithium is not available—it is just not readily available since it takes about five to eight years to develop a new lithium mine. In summary:
•
Lithium is not rare
•
Lowest density metal, solid
•
3,861 mAH/g, highest capacity metal
•
-3.04 V, fifth highest standard electrode potential of any element.
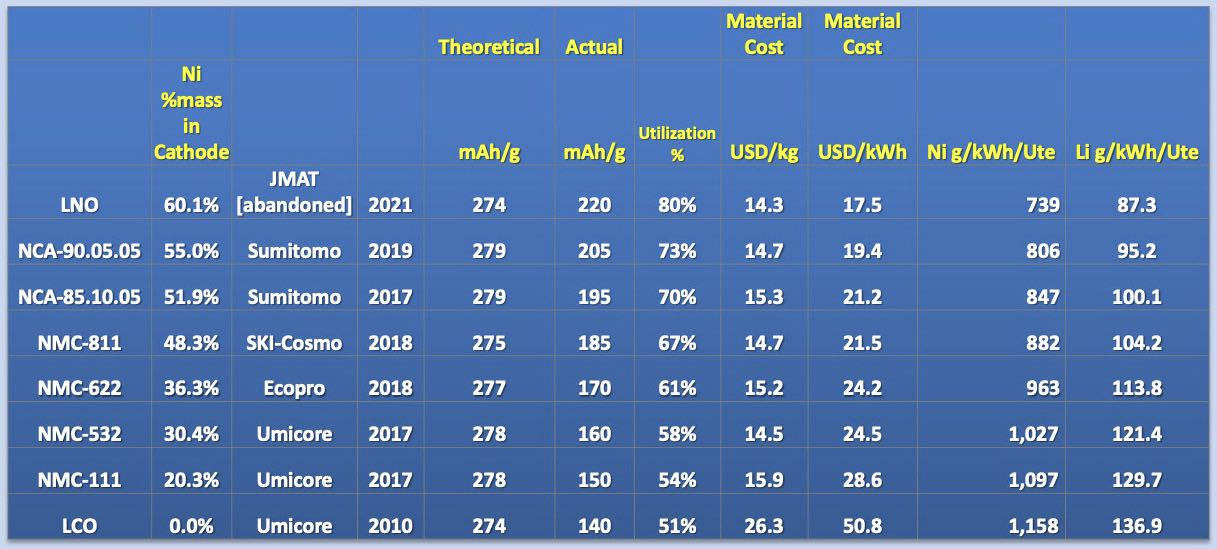
How much lithium do we need? It depends on the chemistry used
(see Table 4). In addition, battery recycling can help alleviate some of the lithium availability issues. For example, looking at 2030 as shown in Figure 3, there is a low volume of batteries built in 2020, which are retiring in 2030, thus the volume available from battery recycling is low, but it is getting more significant by 2040.
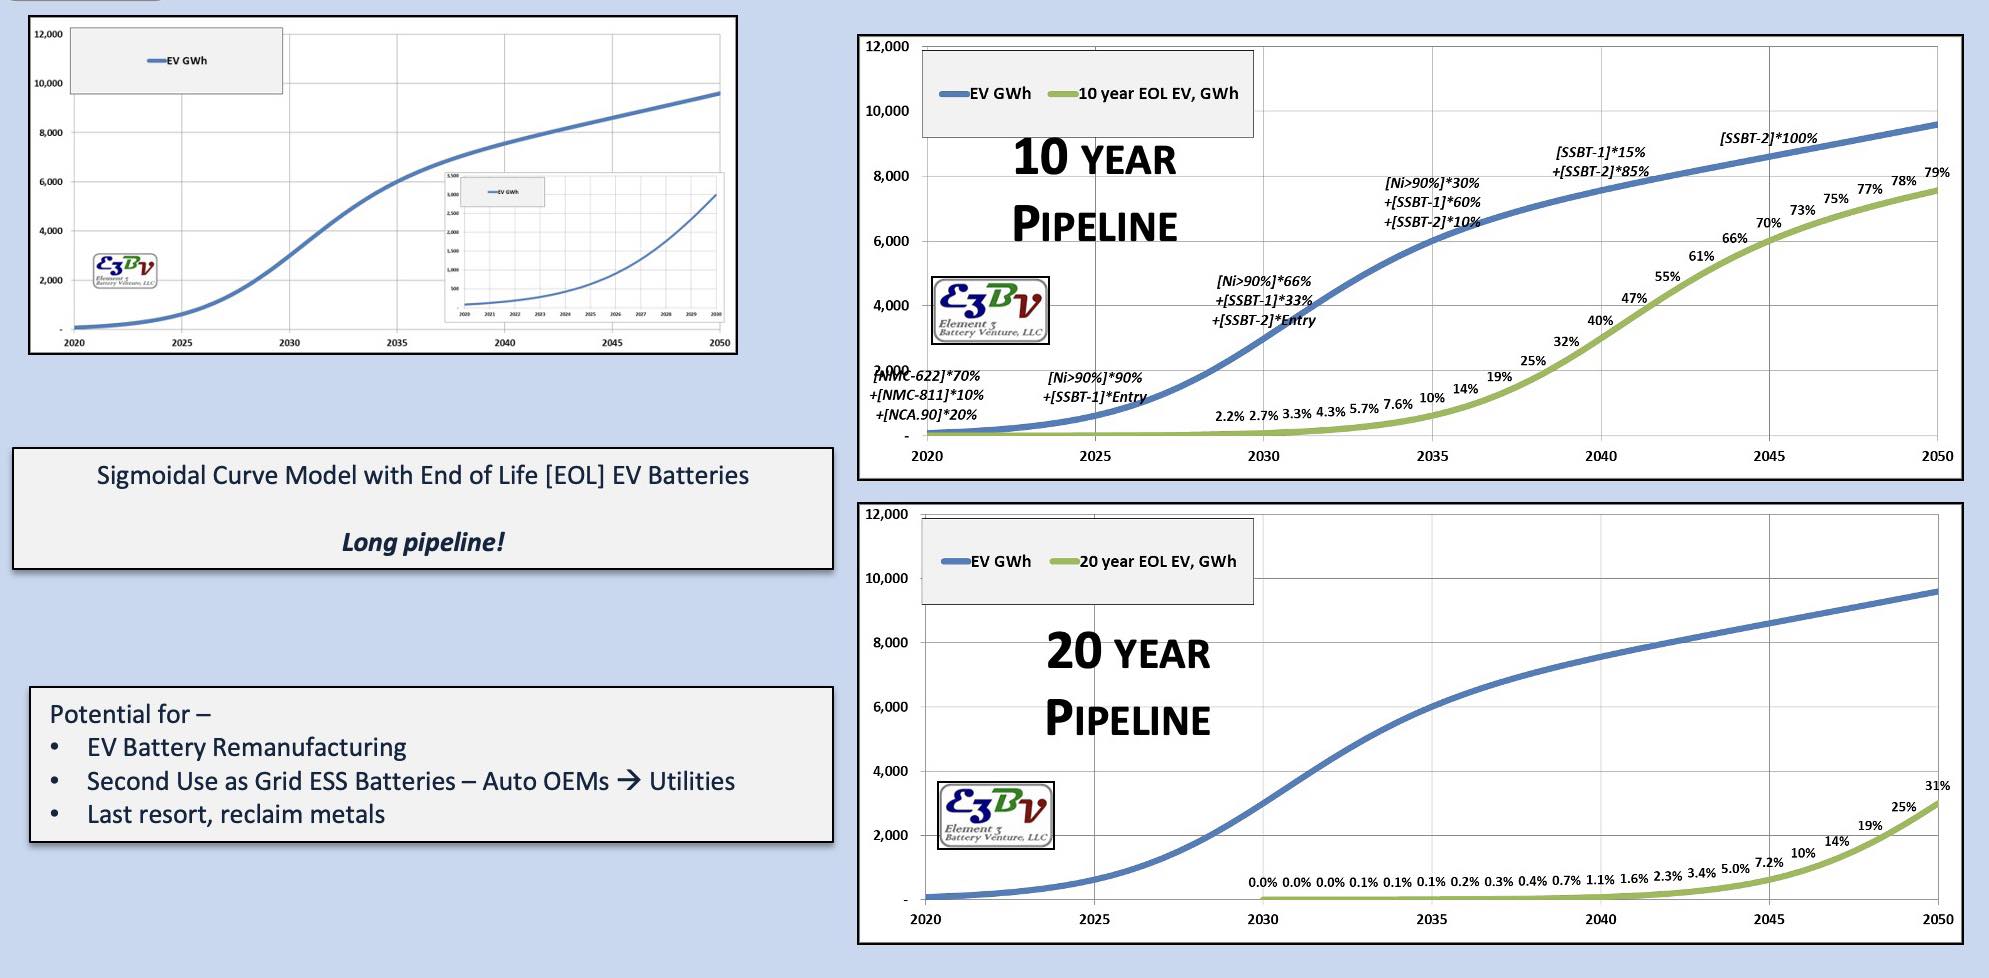
Figure 3. LIB manufacturing industry growth, end-of-life EV battery/recycling.
Table 4. How much Li per kWh? Effect of cathode active material (CAM) technology
There are several pathways for lithium battery recycling:
•
EV battery remanufacturing (direct recycling)
•
Second use
-
Grid energy storage—utility and behind the meter, capacity firming of renewables, grid stability—battery assemblers
-
Forklifts, materials handling, floor cleaners, robotics
-
Commercial backup power—telecommunications networks, data centers, hotels, business centers
•
Emerging hydrometallurgical recycling
-
Cell repair
-
Electrode recovery
-
Active cathode material recovery
-
Metal salts—precursors to make cathode materials
•
Pyrometallurgical recycling
-
Smelting to recover metals using high temperature rotary kilns—existing industry
-
Adaptation of existing lead smelting Lead acid battery manufacturers
-
Independent lead acid battery recyclers
-
Adaptation of existing mineral processing industry.
Competition among EV battery makers
EV battery makers are lacking innovative solutions for the EV segment as mostly they are focusing on the same type of technology. Most LI cells go into small devices where sellers can attach other fees to justify high prices, making LI cells’ cost not as problematic. Whereas for the EV OEMs cost plays a high role. Figure 4 shows the model which can be modified for gradual adding of different new technologies/ materials. Table 5 shows all recent innovations in the LIB space. In order to project energy density, as an example, the anode layer can be reduced from 75 micron to 25 micron. This reduction will give an immediate improvement in energy density. Figure 5 shows how materials influence the cost, which can be projected with the model.
Table 5. The upside of advanced active materials technologies
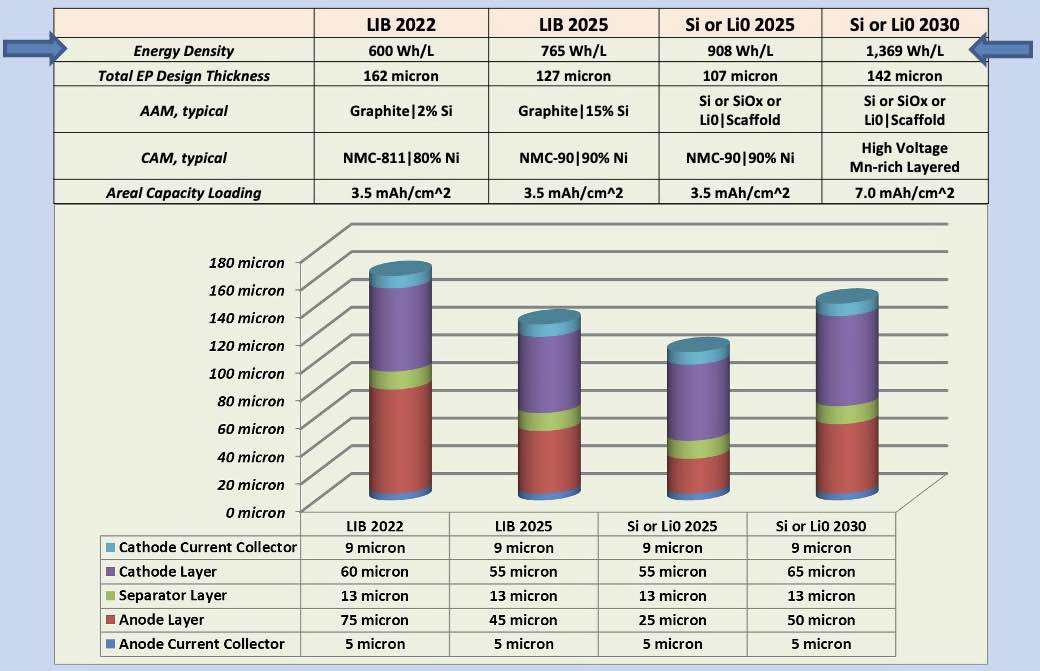
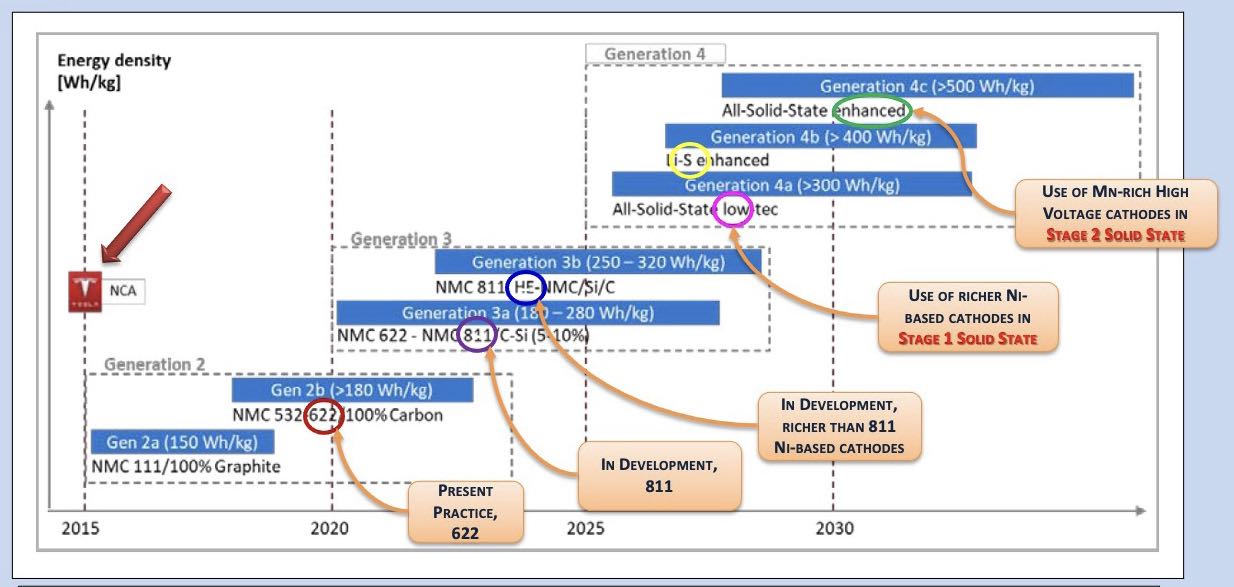
Figure 4. Active material progression—improves Wh/L and Wh/kg—a very busy space! Figure courtesy of Sharova, V., et al. (2020), “Evaluation of lithium-ion battery cell value chain,” Working Paper Forschungsförderung (168), Hans-Böckler-Stiftung, Düsseldorf. Available at www.econstor.eu/bitstream/10419/217243/1/hbs-fofoe-wp-168-2020.pdf.
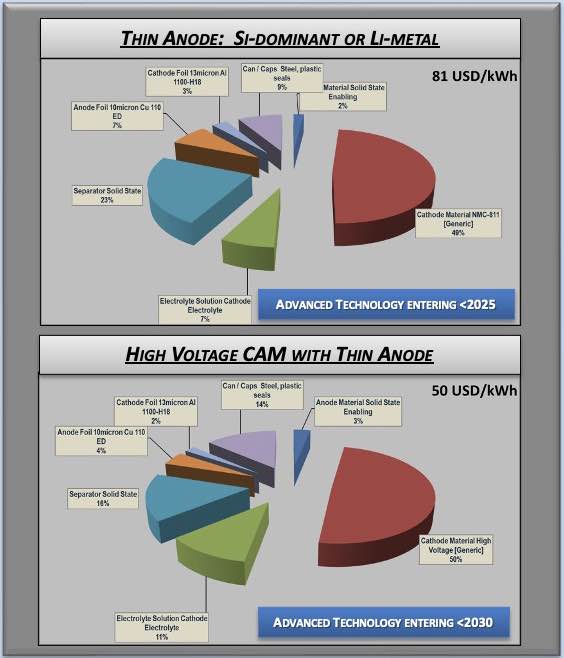
Figure 5. Advanced active materials technologies reduce materials cost, USD/kWh.
Remaining challenges
There are remaining challenges to commercializing advanced active materials. Table 6 shows that one of the major problems is a cycle life. For example, the silicon- dominant anode has a short cycle life below 600 hours.
Table 6. The engineering challenges of advanced active materials
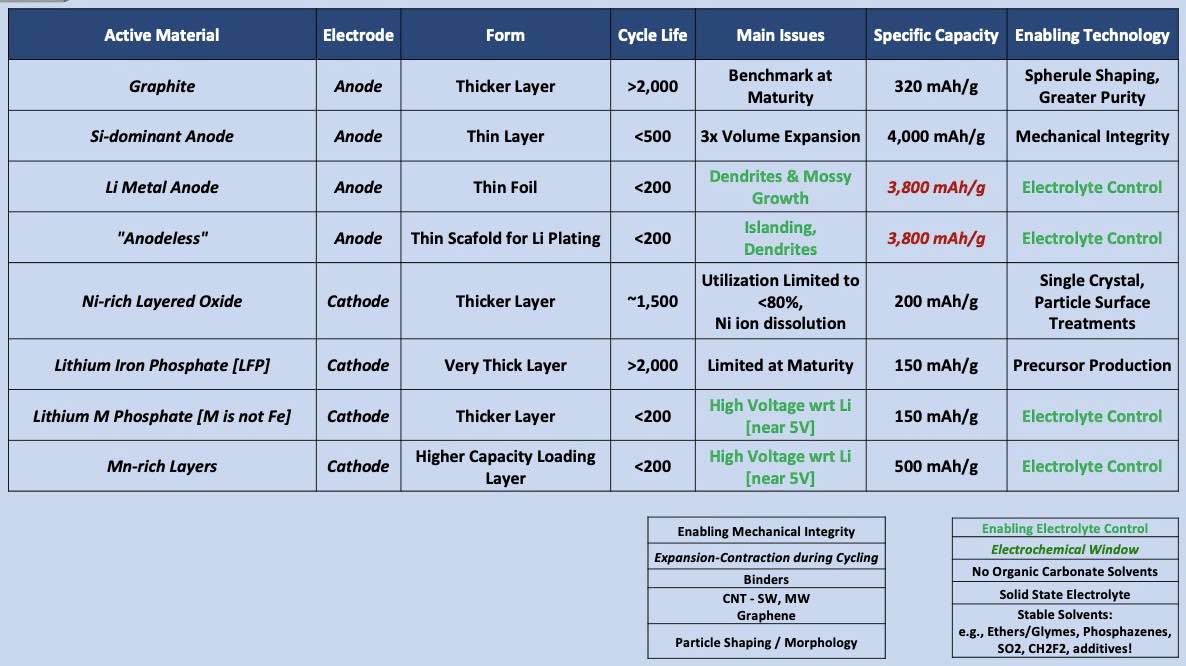
Here are innovations that improve materials mechanical integrity:
•
Expansion-contraction during cycling
•
Binders
•
Carbon nano tubes, graphene
•
Particle shaping/morphology.
There also is a lot of progress on enabling electrolyte control to make them more stable, i.e., improving electrochemical stability window:
•
No organic carbonate solvents
•
Solid-state electrolyte
•
Stable solvents: e.g., ethers/glymes, phosphazenes, SO
2, CH
2F
2, additives.
Table 7. Predicting solid-state battery technology winner
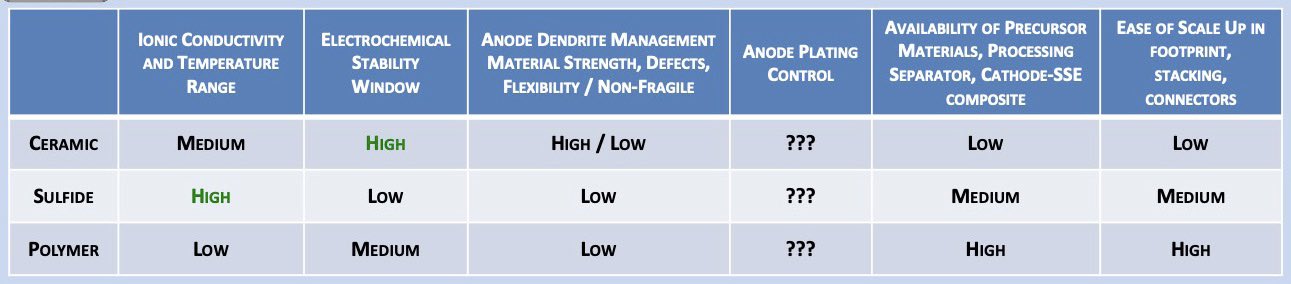
Table 7 shows that it is hard to select a winner among solid-state materials. There will be more than one winner—too many factors are undetermined, and commercialization relies on success for multiple factors:
•
Commercial scale up
-
Consistency/uniformity in large batches “campaigns”
-
True assessment of technology readiness level (TRL)—requires “open kimono”
-
Supply chain development—ceramics, glasses, polymers
•
Long-lasting solid-state design—performance at end of life (EOL) versus OEM warranty
-
Protection against lithium dendrite growth
-
Loss of lithium—stability of cathode materials—especially unproven novel high voltage cathodes
-
Loss of rate capability for fast charging—several failure modes/ root causes
-
Mechanical endurance - LI EV batteries—the empire strikes back (sort of)
-
Improved electrolyte solvents—“ million mile” battery technology and liquid for Li metal plating
-
Silicon anode—price point unknown, but enables higher energy density, closer to as Stage 1 solid-state battery technology (pre-lithiation)
-
Designs for lower cost manufacturing
•
Materials design and engineering.
Battery technology level innovations
There are numerous innovations within battery technology level, e.g., related to battery electronics, such as wireless battery management system, and some of the benefits are:
•
Increase reliability by removing harnesses and wiring
•
Scalable and reusable designs
•
Easement to mount, serve and repair Table 7. Predicting solid-state battery technology winner
•
Lightness
•
Nodes communication in wireless star network topology
•
Simpler high voltage/low voltage isolation concept.
Another innovation is within cell assembly. To minimize thermal management, LI phosphate cells are used, which require less cooling and save space.

In summary, the science behind battery development is multi-disciplinary and spans through a lot of different subjects such as electrochemistry, electronics, modeling, ionic transport, thermal analysis, organic chemistry, physical chemistry, materials science, etc. Battery research and development draws various scientists and engineers who help drive innovation and technology forward. With the widespread adoption of EVs, it is optimal timing to support the growth from different angles.
Models featured in this article were created using BatPaC Battery Manufacturing Cost Estimation: https://www.anl.gov/partnerships/batpac-battery-manufacturing-cost-estimation
Dr. Yulia Sosa is a freelance writer based in Peachtree City, Ga. You can contact her at dr.yulia.sosa@gmail.com.