TLT: How long have you worked in a lubrication-related field, and how did you decide to pursue a career in the lubricants industry?
Wooton: I have worked in this industry for more than 45 years—since 1977 when I joined Edwin-Cooper (now Afton Chemical Co.). The company asked me to start and build a non-existing analytical group for its R&D department. I saw the diversity of analytical potential for this industry. No matter what area of analytics you are interested in, it can exist in this industry. And in that time of history, there was a very rapid growth of analytical chemistry—little of it was being employed extensively in the industry, so you could be on the frontline quickly.
TLT: What has been your most rewarding accomplishment throughout your career in the lubricants industry?
Wooton: There have been several projects that I am proud of. I remember in the mid-1980s working on infrared spectra of soot loaded in-service oils. This was the time when infrared spectra were from gradient-type spectrometers with lower optical throughput than the Fourier transform infrared (FTIR) spectrometers of today—making it ever more difficult. With gradient spectrometers, one couldn’t get optical throughput above about 3% soot loaded samples. Today, with FTIR one has an upper limit of 5.5%-6.0% soot loadings. A colleague and I were discussing the problems of the day’s works with soot loading of the samples blocking our obtaining infrared spectra over dinner, when one of us mentioned that Rayleigh scattering was the problem. We wrote down the scattering equations on a napkin. The next day, we proved the scattering relationship to percentage of soot in the in-service lube oil sample and, with aid from Debye equations, the relationship to the soot agglomeration size to the infrared wavelength. The Rayleigh equations describe a relationship between the scattering or total light throughput with a constant function to the concentration of what is causing the scattering (the soot)—which means one can develop a calibration curve of percent soot and absorbance (at single wavelength) to measure soot concentrations in unknown samples
(see Figure 1).
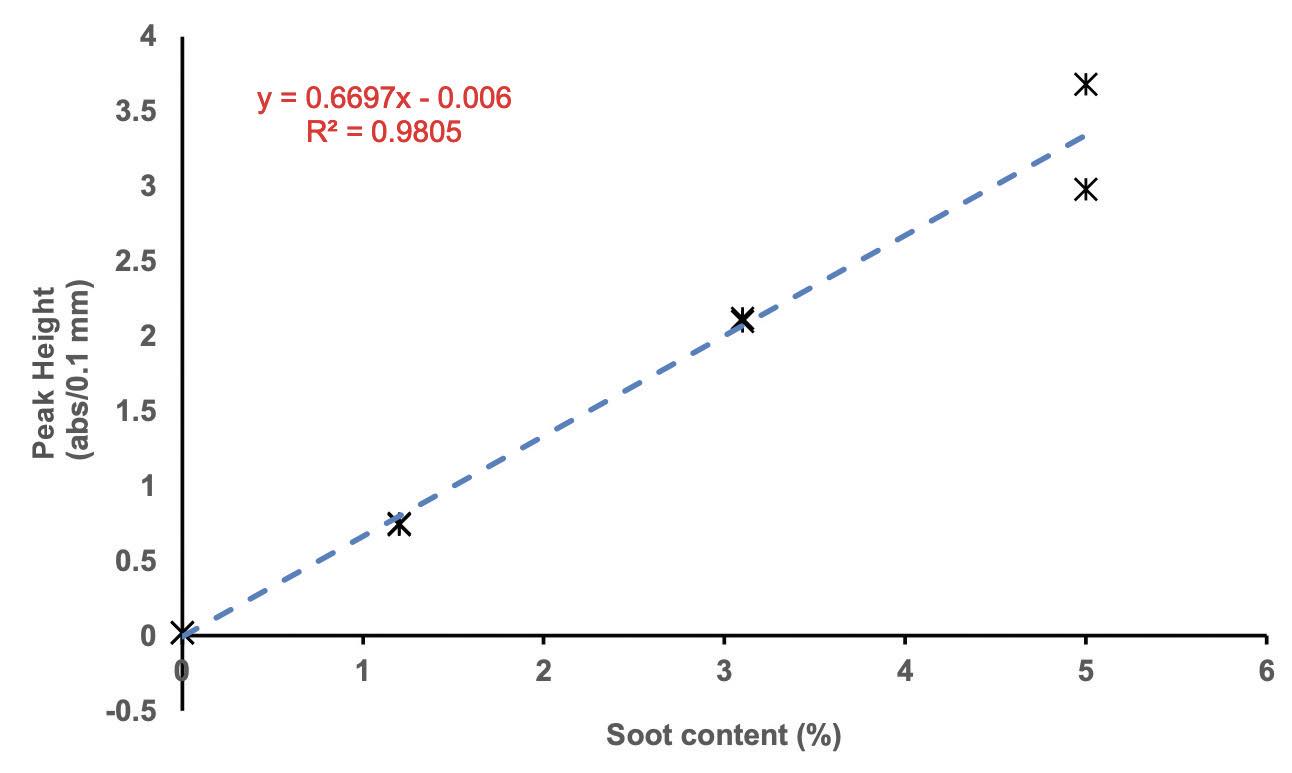
Figure 1. Soot calibration curve. Figure courtesy of D.L. Wooton.
The Debye equation is what has been used to calculate the molecular weight of polymers from the light scattering measurements. We used measurements at various infrared wavelengths to calculate the slope differences as our measurement to report. We chose three wavelengths to study (3,850, 1,950 and 650 cm-1) and measured the absorbance at these wavelengths for our methodology
(see Figure 2).
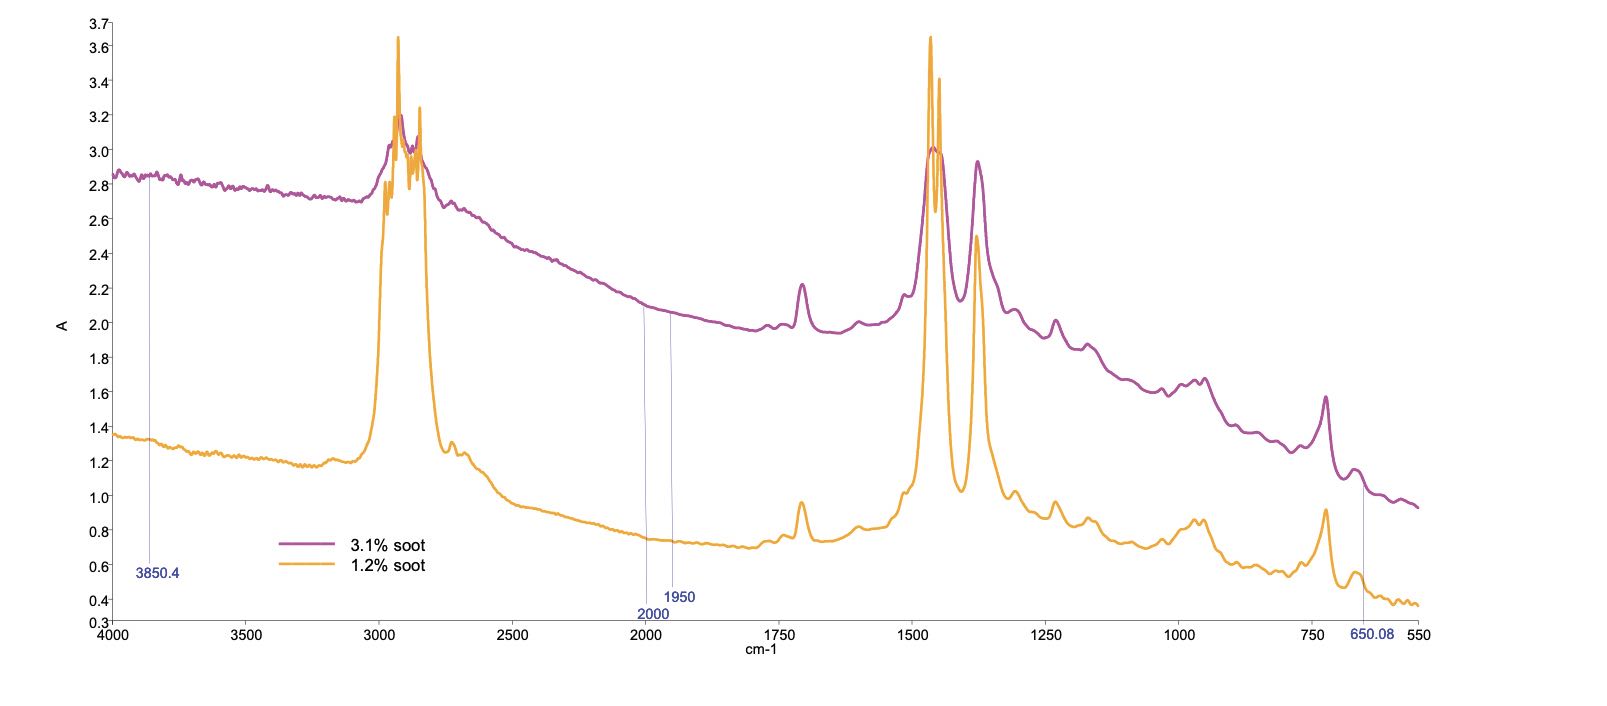 Figure 2. FTIR spectrum of diesel engine in-service oil. Figure courtesy of D.L. Wooton.
This gave us a line slope of the wavelength dependency for the optical throughput for the samples. The two end points were just away from the spectrum end points (which sometimes gave troubles due to the spectrometer’s gradient). The center point (1,950 cm
-1) was just off the center gradient change frequency. The soot concentration was chosen to be related to this center point. As time progressed and the FTIR spectrometer took over the industry, the 1,950 cm
-1 center point was migrated to 2,000 cm
-1, since with the FTIR spectrometers there was no gradient change at 2,000 cm
-1. The soot size was correlated to the baseline slope. The baseline slope is linear for transmission spectra allowing the three points to be sufficient. The relationship between soot size and wavelength is a third order relation. With transmission spectra, one sees only the first order relation.
However, with attenuated total reflectance (ATR) techniques, one can see the second and sometimes third order effects with high soot value (10%-15% soot samples). At that time, soot percentage and agglomeration size were causing major issues in the diesel engine oil market. All the diesel engine OEMs had different combustion characteristics and, thus, different soot agglomeration sizes. Sizes also were found to be related to the fluid’s formulation. We had to develop different calibrations for each OEM’s engine to study the formulation changes. Eventually they worked out their combustion issues with newer engines by the late 1980s and leveled out the slope differences. Moving forward, the spectrometers have moved to FTIR spectrometers with better optical throughput, and with the size becoming only valued to R&D, percentage continued to be valued. The methodology also has migrated to the use of visible light and even optical sensor probes—still using the same concept of optical density measurement versus concentration. Today there are estimated over 50 million in-service oils analyzed by this methodology under ASTM D7844—a long way from our dinner with a napkin.
Then there has been the project of varnish characterization: defining methods where I can “clean” the varnish sample, separate different chemistries of the varnish into different samples and characterize the chemistries and association of these chemistries to root causes. I have seen more than 100 different chemistries from samples that I was told were varnish when I was given the sample. This has made it challenging to achieve each phase of the characterization.
When it comes to “cleaning” the sample, one finds that the varnish sample is almost always contaminated with the fluid it came from. This contamination is sometimes over 90% of the sample received. Water also can be a contamination source. Water is everywhere, making it a common contamination. You shouldn’t characterize anything until it is clean and not a mix of chemistries.
Separation into different chemistries allows identification of the different chemistries and allows association with different root causes. This took a combination of solvent extractions and various forms of liquid chromatography separations to address the variety of chemistries found. Different chemistries are soluble in different solvent, making this always the first approach. When extended separations were needed, the use of solid phase extraction (SEP) columns helped to achieve nice chemical partitioning.
Characterization needed to involve inductively coupled plasma (ICP) or X-ray fluorescence (XRF) elementals, FTIR and/ or nuclear magnetic resonance (NMR) spectral identification or even mass spectral identification if required. I liked FTIR techniques because I could get IDs with as low as 5 mg sample sizes. I remember one project where I isolated ~10 mg of sample off a valve and produced publication quality spectra showing the customer what his root cause was.
This project has led to the development of the “Complete Guide to Lubricant Deposit Characterization.”
1
This guide breaks down the varnish (or deposit) to a series of different chemistry types—each chemistry has a defined method of separation and a defined source (or root cause)
(see Figure 3). Many projects identify more than one classification bin. Take one example: a gas turbine. This unit is known to experience electric spark discharge (ESD) within its inland gas valve (IGV) filter to generate a thermoplastic varnish. This ESD also depletes the fluid’s antioxidants, which causes the formation of oxidatively derived varnish. As a part of this oxidation, the phosphorous antiwear oxidized to produce inorganic phosphates (an inorganic varnish). Thus, we have identified three varnishes—thermoplastic, oxidatively derived and inorganic varnishes— and with three causes and one root cause to investigate.
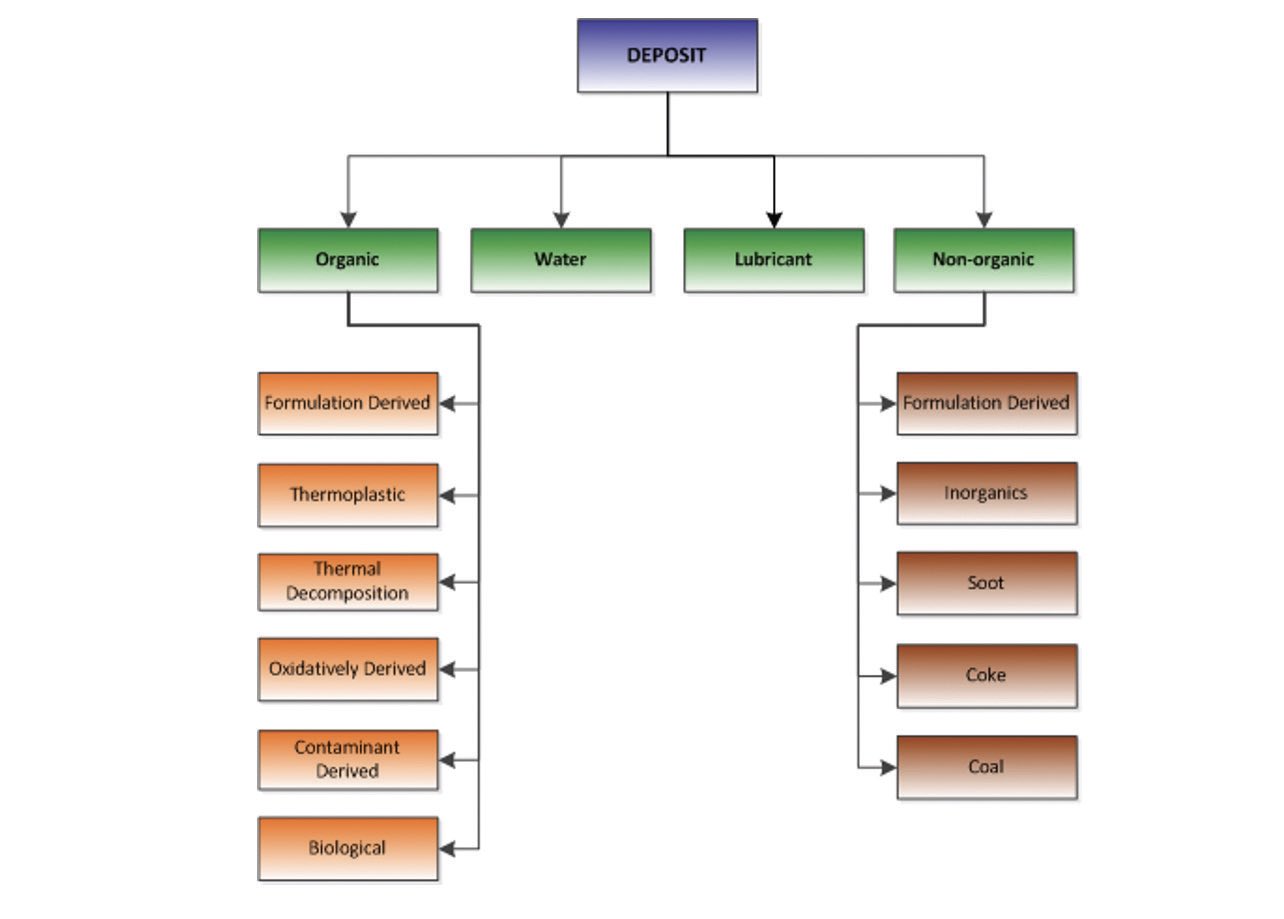 Figure 3. Deposit classification. Figure courtesy of D.L. Wooton.
TLT: What is the No. 1 piece of advice you would give to a person who might be interested in starting a career in the lubricants industry?
Wooton: Whenever someone asks to develop something new, say you’ll try to do it, even if you don’t know how at that time. This forces you to learn something new. Find someone that knows how to do it, and learn from them—or learn something totally new yourself and become the expert in this new area. Either can be fun.
TLT: Throughout the different segments within your career, which one has been the most interesting, challenging and/ or rewarding?
Wooton: Varnish characterization. This has required the most diversity of techniques, is difficult to work through, and I had to learn the most to succeed. There were collection isolation and separation techniques I needed to master, as well as identification methods needing mastering. I needed to work closely with the customers to find true root causes and provide the most value to the customer when I came up with the final answer. This was rewarding to see how my work helped them with production problems. I needed to understand that the samples I’ve been given are often on a metal surface and needed to be collected such that I don’t destroy its history but still remove the contamination with the lubricant it came out of.
TLT: What are some of the most technical lubrication-based concepts or topics you have encountered throughout your career?
Wooton: I am primarily an analytical chemist, so analytical projects on lubricant samples is what I spent most of my time doing and where the toughest projects emerged. Two things come to mind right away: FTIR spectral identification and varnish separation.
As I used FTIR for sample identification, my skill became better at it. I learned better where spectral absorptions were located, but also the subtleties seen in the spectra. Peak intensities and widths have more importance than I originally thought. Yes, peak position tells chemistry, but peak width and peak intensities yield valuable information to aid conclusions. Then there are always secondary peaks to support the primary peak locations.
As I started to better understand the chemistry of varnish, I started to realize there was no such thing as “pure” varnish. Varnish is a combination of similar and dissimilar chemistries. If you expect to understand the root cause of the varnish (and stop guessing), you need all the different chemistries properly identified. Similar chemistries sometimes (but not all the time) can be lumped together. Lubricants are all mixtures: impure mixtures of additive chemistries, mixtures of additives to make a formulation and mixtures of reaction of these to make varnish. And the varnishes were all contaminated with the fluid and formation that required isolation.
A systematic approach needed to be developed to first separate dissimilar chemistries. This, many times, might be as simple as solvent partitioning or as complex as multiple chromatographic separations. All needed to be learned and modified based on varnish being studied. A knowledge of what goes into the formulation was needed to support the projects, so an additive wasn’t misidentified as a varnish. The toughest thing was to know when I had done enough to answer the question. There always was more to do, working toward an individual compound, but know that enough information was determined to answer the requestor’s questions and was key.
 Dr. David L. Wooton performing an examination by looking into a microscope.
TLT: What is the one thing you wish had been different earlier in your career?
Wooton: I wish we would have had better computers sooner. Computers started appearing in NMR instruments in the early 1970s. Fourier transform nuclear magnetic resonance (FT-NMR) instruments were promoted from the fact that they exhibited a tremendous advantage over the current constant wave (CW) instrument. I remember opening a celebratory bottle of champagne when we installed a 4-K memory board into our NMR computer. Our next instrument fitted with a computer was an infrared spectrometer. It was first put on a CW instrument then migrated to FT instruments. Our storage was to 370 Kb, a 5-1/4-inch floppy disk. This is an area I spent a lot of time in. We enjoyed every upgrade in computer power, and each new instrumentation fit. Today, most analytical instruments are computerized. Thus, among many other advantages, we are able to store the spectral data for later/further processing, perform sophisticated chemometrics and data mining and search massive storage spectral libraries—increasing our resources tremendously, doing things we never thought were possible.
REFERENCE
1.
Wooton, D. L. and Livingston, G. (July-August 2021), “Complete Guide to Lubricant Deposit Characterization,”
Machinery Lubrication. Available
here.
.