Used oil analysis fundamentals
By Dan Holdmeyer, Contributing Editor | TLT Lubrication Fundamentals December 2022
A quality oil analysis program with a series of consistently timed samples is key to successful preventive maintenance.

A good representative sample was taken and sent to the laboratory, and now the analysis report has arrived. What is done with that information will determine the success, or failure, of the oil analysis program and maybe even the entire operation. Interpretation of the data is the first step, and taking corrective action is the next step to a successful program.
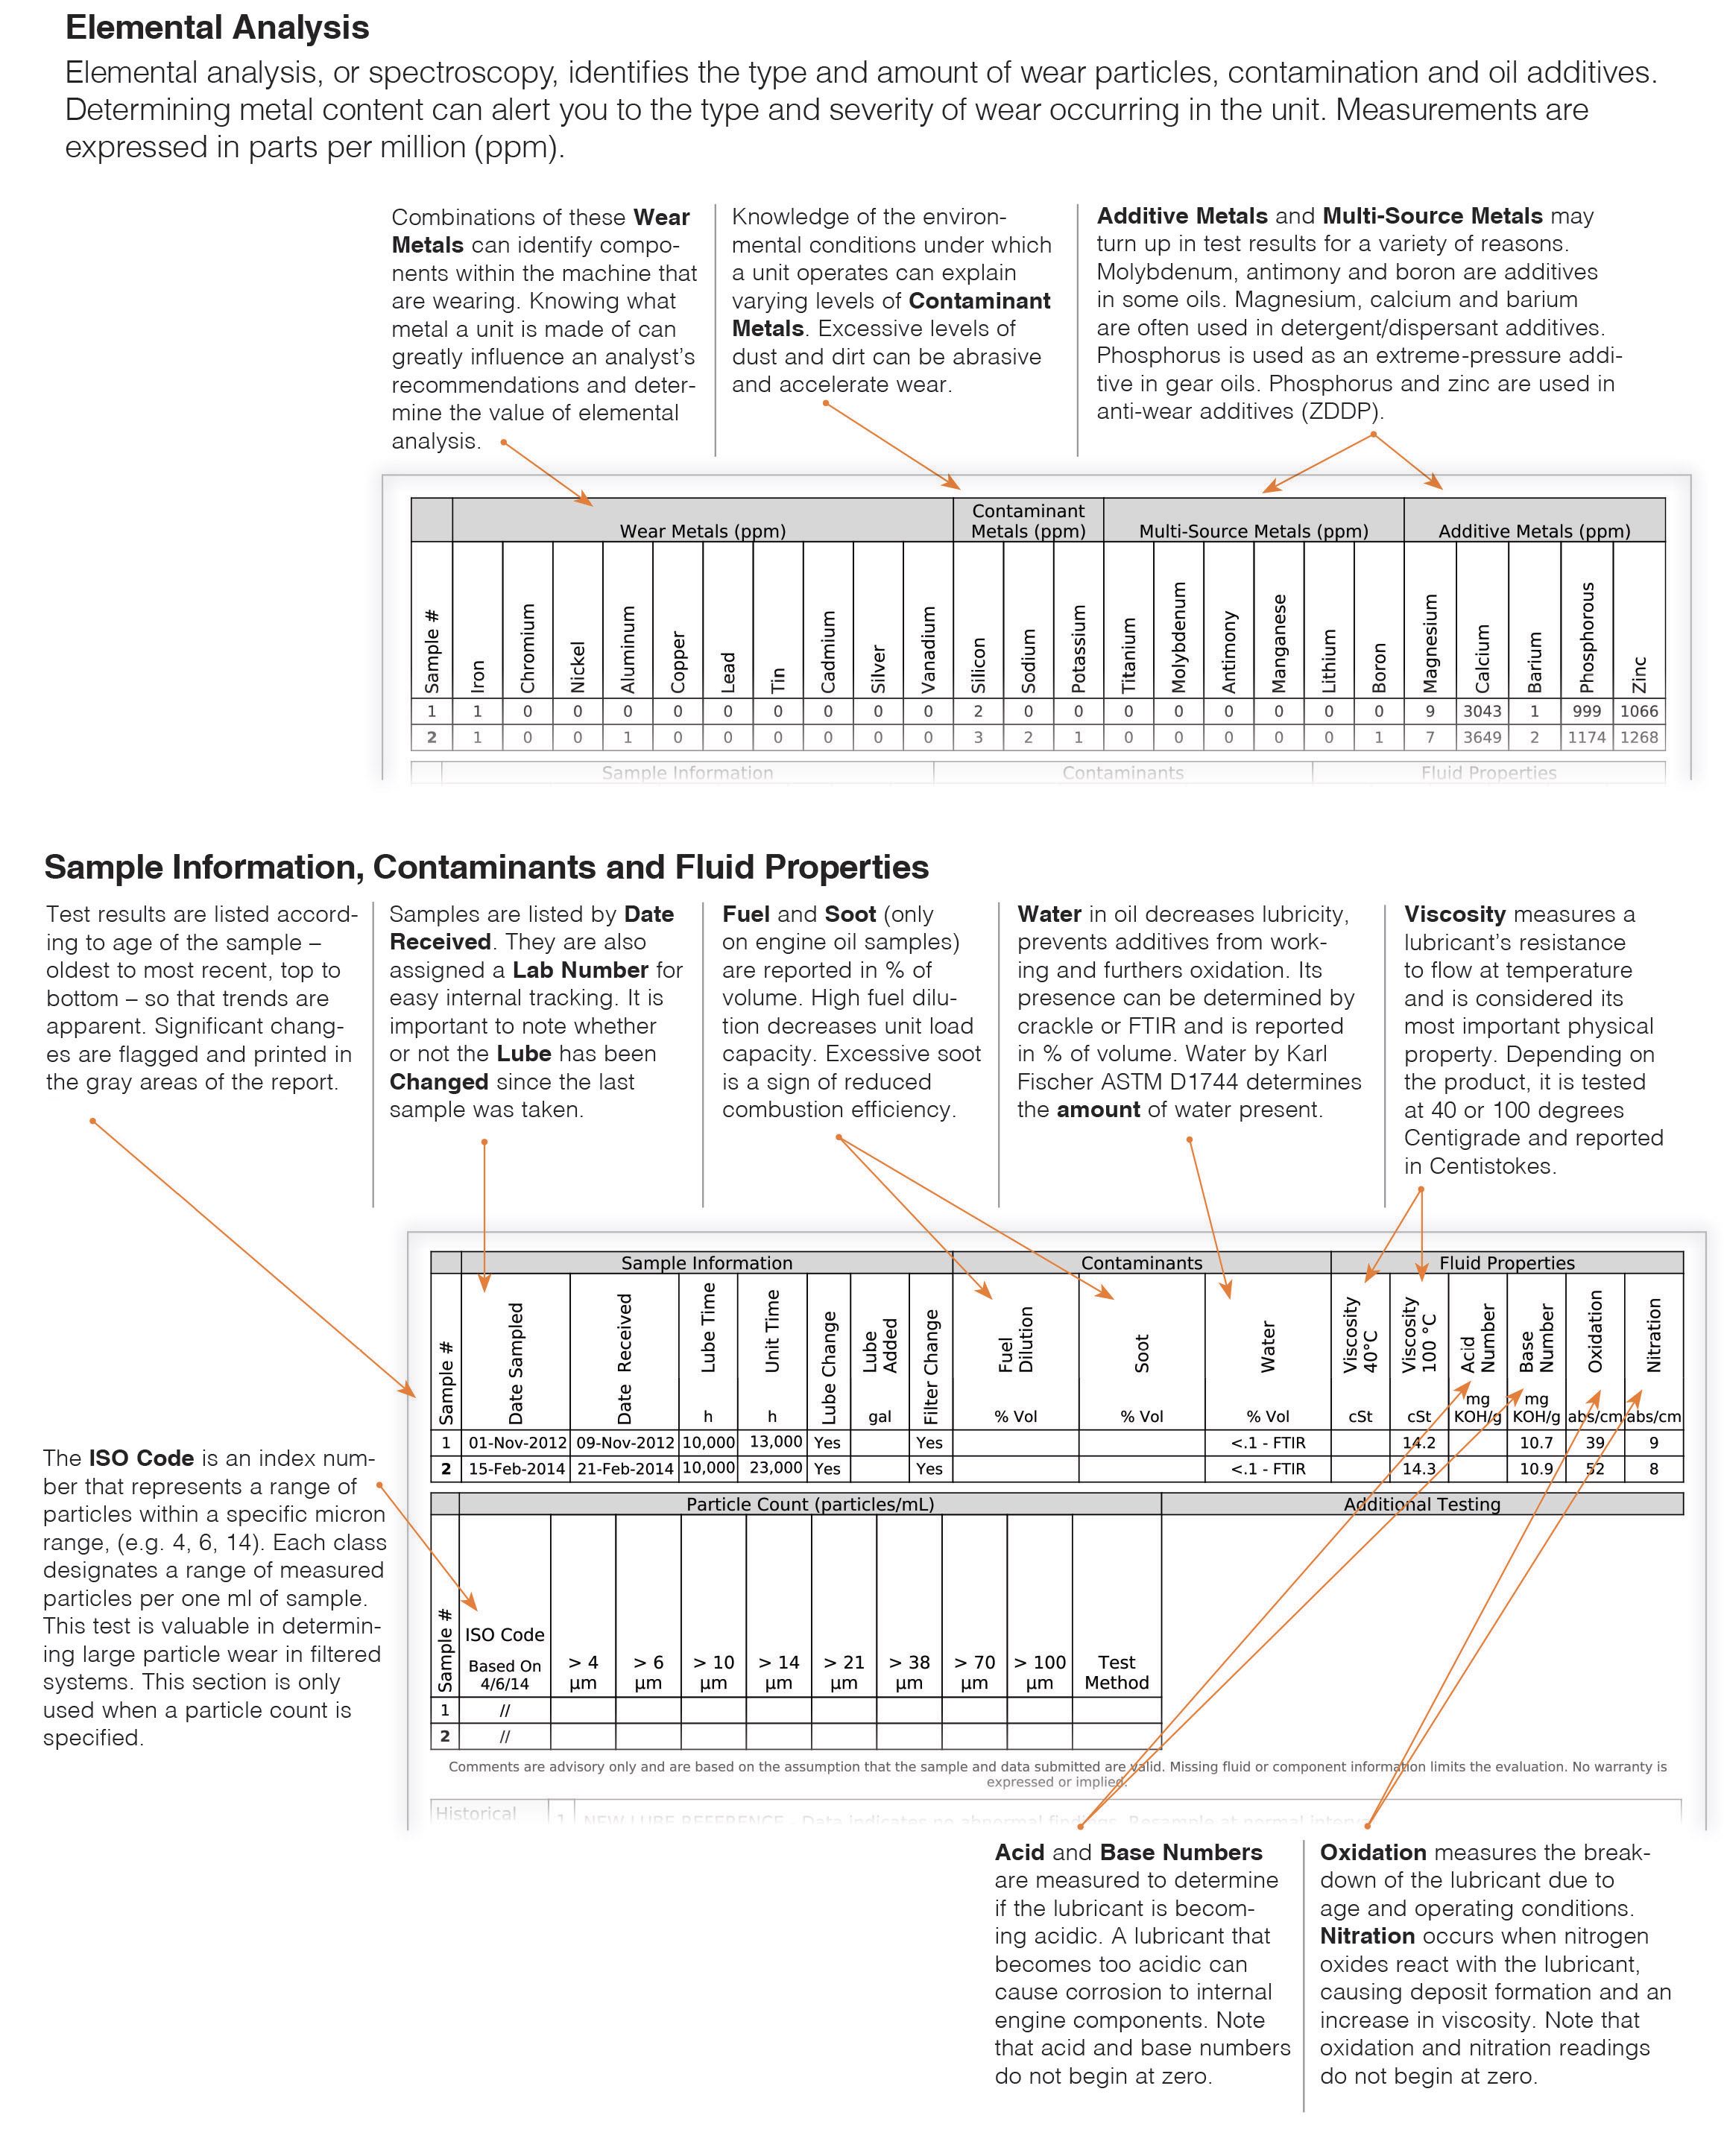
First look at the laboratory report’s equipment information provided to the lab via the sample label (see Figure 1). This will, or should, provide the unit number, the component of what piece of equipment was sampled, the oil used, the hours on the equipment and the oil and if a filter was changed.

Figure 1. Sample oil analysis report. Figure courtesy of AMSOIL INC./Oil Analyzers Inc.
The fluid analysis results provide information in three critical areas: the oil’s physical and chemical health, the equipment wear analysis and the contamination levels.
The first result to look at is the viscosity. It is the most important characteristic of the oil. If the viscosity is not in the range of the oil identified for the sample, the cause needs to be determined. Was the wrong oil listed on the oil sample bottle, or was the wrong oil put into the unit sampled? If the wrong oil was used in the unit, it is critical the oil is drained and the right oil used immediately. If the wrong oil was listed on the sample and the lab flagged the viscosity abnormal, but the viscosity result is correct for the unit, make certain that the data on the label is correct for the next sample.
If the unit sampled is an engine and the viscosity result is low by an SAE grade or more, fuel dilution is a likely cause. Many labs will test a sample for fuel dilution if the oil viscosity result is low. If fuel dilution is not the cause in an engine oil, or if the viscosity is low in the oil of other applications, the wrong lubricant added is a likely cause. Maintenance practices, particularly oil changes and makeup practices, need to be reviewed.
If fuel dilution is detected, the cause should be determined and corrected. Fuel dilution is caused by several maladies such as incomplete combustion, extended idling, faulty fuel injectors or stop-and-go driving, to name a few.
Most laboratories measure engine oil viscosity at 100 C and industrial oils at 40 C because of typical operating temperatures of those systems but also because most engine oils are multigrade oils and are at risk of viscosity index improver (VII) shear down. The oil viscosity at 100 C is most affected by VII shear down. VII shear down may be the result of using a poor-quality engine oil or running too long between oil changes. Oil drain intervals should be benchmarked with OEM expectations, and if the drain intervals are in concert with the OEM recommendations, the oil used needs to be evaluated.
A high oil viscosity analysis result may be indicative of high soot in a diesel engine oil. Soot is a byproduct of diesel combustion. Too much soot may be the result of a plugged air filter, extended oil drain interval or incorrect air to fuel ratio. The root cause of excessive soot needs to be corrected because high soot levels lead to increased wear, filter plugging, poor lubrication, deposit formation and varnish buildup.
High oil viscosity analysis results may be due to oil oxidation and degradation. High operating temperatures, localized hot spots or extended drain intervals will lead to oxidation and degradation of the oil. The lab report should have an oxidation number or acid number (AN) result to show the oil has been oxidized. An increase in acid number indicates acid byproducts formed from the oil oxidation and degradation. The oil should be drained, any oil filters changed and a new charge of oil installed.
Another test result to watch in diesel engine oil samples is the base number (BN). BN is a measure of the engine oil’s “reserve alkalinity” to neutralize acids formed from combustion of the diesel fuel. Severe reductions in the amount of sulfur in diesel fuel have dramatically reduced the rate of BN depletion in used engine oils, but it is still good to watch. A decade or two ago, the rule was to change engine oil when BN (then TBN, or total base number) reached 50% of new oil BN level. However, today the rule is not so strict with some allowing BN to reach 2, versus a 10 for new oil, before changing the oil. Others recommend changing the engine oil when the base number drops below the rising AN.
Abnormal AN or a high oxidation level are good indicators of time to change the oil in most applications. If the AN or oxidation level is high, the oil has degraded and will no longer protect the equipment as well as it should. It is likely that as the AN or oxidation level rises, particularly if the BN is dropping in the case of diesel engine oil, other test results such as wear metals will become abnormal indicating time to change the oil. Even if no other result indicates a need to change the oil, the oil should be changed if it has abnormal AN or oxidation level.
Another chemical oil analysis result to review is the lubricant metallic additives. Although, the metallic additive levels generally do not change with use because as the additive is activated or used, the metal still remains in the oil. It is still good to note the levels of zinc, magnesium, calcium, phosphorus and other metallic additives to know that the right oil is used or that it is not contaminated with another oil. Magnesium and calcium are common detergent additives in engine oils but are not typically found in industrial oils.
Equipment wear metals vary greatly with equipment and components, but the common wear metals to watch are iron, chromium, nickel, aluminum, copper, lead, tin and silver. The idea here is to monitor trends in wear metals in a component’s oil analysis results. So long as the results are drawn from the same spot in the component at the same number of operating hours, a relatively flat line graphing wear level is normal. A sudden spike in a wear metal may be reason to investigate the root cause. If, however, a spike in iron wear in a gearbox is noted, but the oil drain interval was double the time of previous samplings, the spike in iron may not be a concern. The wear may be normal for twice the operating time for the oil charge. Also, if it is only one wear metal for one sample, another sample would likely be the best follow up step. But, if wear metal results spike in conjunction with other wear metals or other abnormalities, corrective action may be warranted.
As an example, a rise in silicon indicative of dirt contamination is associated with an increase in iron wear; system filters, air and oil should be checked as well as any reservoir caps to make sure they seal properly and are in place. In the case of a diesel engine, a rise in silicon and iron accompanied with an increase in chromium is usually an indication of air filter leak allowing dirt to enter the engine combustion chamber causing wear on the chromium coated rings and iron cylinder. Engine bearings may have lead, aluminum, tin and copper along with iron, and so a rise in these wear metals along with an increase in AN may indicate corrosion taking place.
A more generic example would be that a rise in copper may be associated with oil coolers, or if copper is associated with tin, any bronze components may be experiencing wear. Various systems have a myriad of metals and, thus, once abnormal wear metal levels are indicated, the system needs to be studied to find internal components with those metals.
Water contamination is a problem both for lubrication and for detection. Most gearsets and virtually all engines operate at temperatures to evaporate any water contamination unless there is a cooler leak that continues to leak after shutdown. If water contamination is indicated, it is time to find the source and eliminate it.
Coolant leaks in engines will quickly destroy an engine, but water contamination from a coolant will likely go undetected due to the operating temperatures in the engine. Therefore, to detect an engine coolant leak, potassium, sodium and boron are monitored as these are typical coolant additives that remain behind in the oil after the water has evaporated. If any of these additives appear elevated, and there are any other anomalies in the analysis, take quick action to locate the coolant leak and repair it. An engine overhaul may be required, but if caught early, the total overhaul cost may be greatly reduced.
Silicon is associated with dirt contamination but may be from a gasket repair or as an additive. Therefore, the presence of silicon doesn’t always mean dirt, but a spike in silicon level deserves investigation to determine the source. Dirt will usually have some trace amounts of alumina that shows up as aluminum along with silicon.
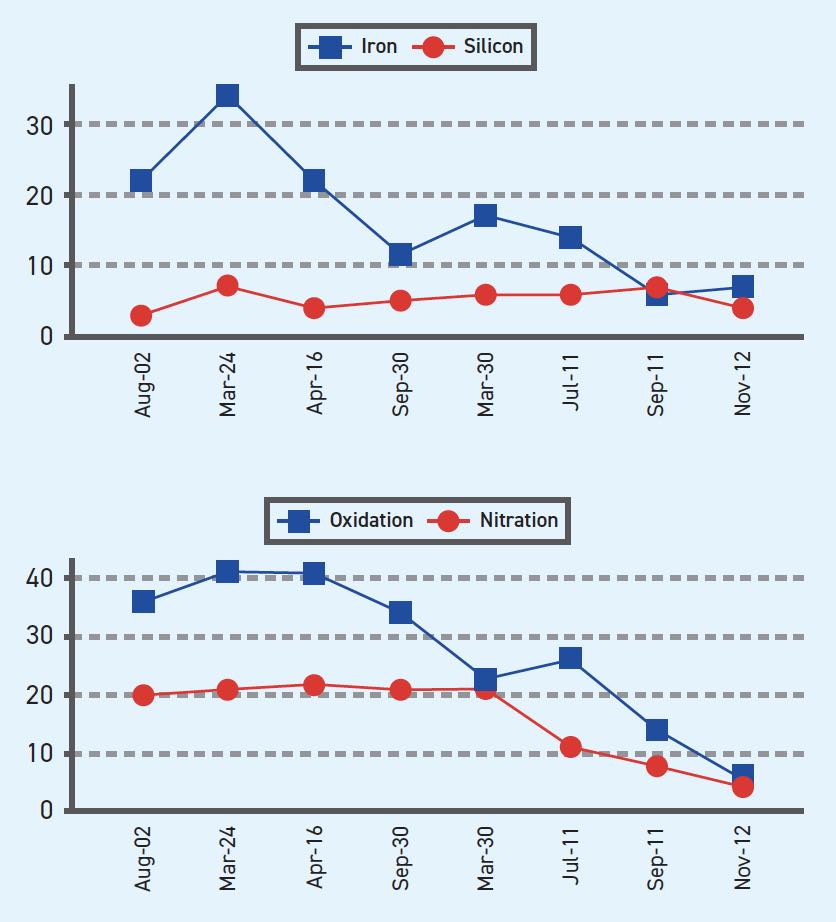
A good preventive maintenance program benefits from a quality oil analysis program, consisting of a series of evenly spaced representative used oil samples versus a one-time sample of a unit, followed by analysis interpretation of trends in the data and then quick corrective action (see Figure 2). A single sample may help detect an engine “killer” such as a coolant leak, fuel dilution or high soot before the engine fails, but the timing required to catch these engine “killers” before failure usually relies on good luck.

Figure 2. Oil analysis trending. Figure courtesy of AMSOIL INC./Oil Analyzers Inc.
Dan Holdmeyer is retired from Chevron Lubricants and is based in Washington, Mo. You can reach him at dan.holdmeyer@gmail.com.