Failure probability curves
Evan Zabawski | TLT From the Editor February 2018
A common belief is not entirely true.

The bathtub curve is commonly believed to apply to most components.
THE UBIQUITOUS BATHTUB CURVE—hardly any presentation on failure modes excludes discussing it. Though it is frequently discussed, its unlikely occurrence is only occasionally quantified, and it is almost never revealed to be an aggregate of three other probability curves.
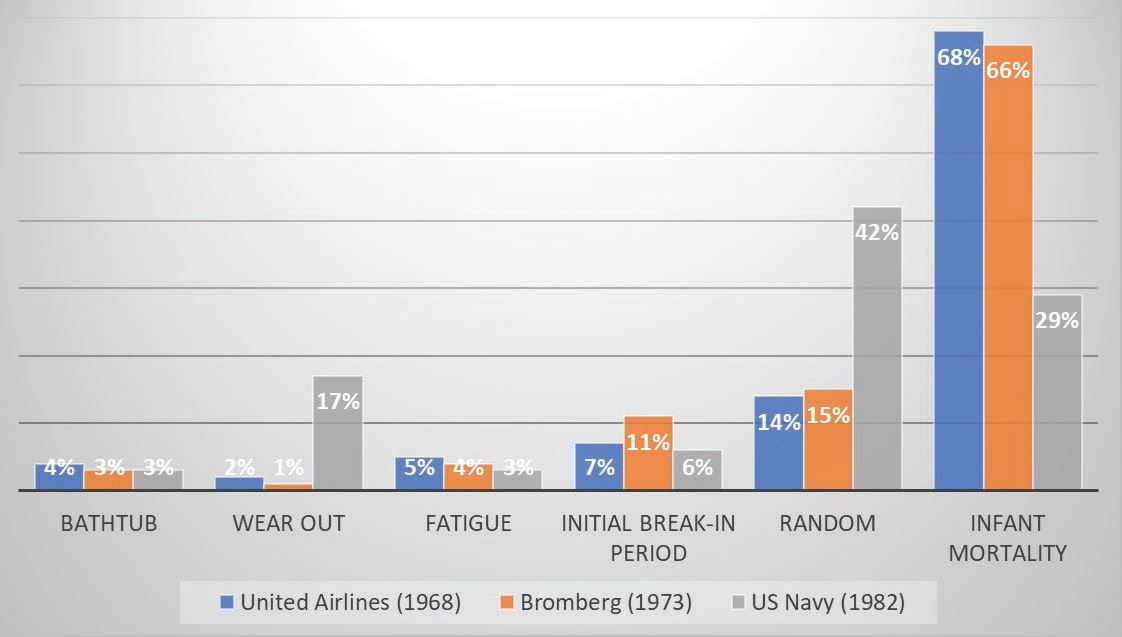
When United Airline engineers Stan Nowlan and Howard Heap published Reliability-Centered Maintenance in 1978, they identified six basic patterns for conditional probability of failure. They are the bathtub curve, wearout, fatigue, initial break-in period, random and infant mortality. The first three curves were grouped together as age-related, and the latter three grouped together as non-age-related.
Nowlan and Heap supplied percentages of items that fell into each of the patterns based on data collected in 1968. Similar data on aircraft failures had been collected by Blomberg in Sweden in 1973, utilizing the same patterns, with remarkably similar percentages (four categories agreeing to within 1%, the remaining at 2% and 4% variance).
Though both data sets emphasized that 89%-92% of the failures were from non-age-related patterns, the bathtub curve is commonly believed to apply to most components. The truth becomes more apparent when the bathtub curve is dissected.
In reality, the bathtub curve is not really a unique pattern but rather an aggregate of the infant mortality, random and wearout curves. While wearout only accounts for 1%-2% of the failure, and random assigned to a further 14%-15%, the vast majority (66%-68%) is attributed to infant mortality. The aggregate scoring would then suggest 82%-84% of the failures should fall under the bathtub curve, but that is not exactly how failures are classified into patterns.
Essentially the wearout curve depicts items that display a constant of gradually increasing probability of failure followed by a pronounced wearout region, whereas infant mortality depicts a high probability region followed by a sharply decreasing curve, and random depicts as a flat line without slope.
For the failures of an item to be classified as following the bathtub curve, it would have to show both a high probability of failure when new (infant mortality) and when old (wearout), with a significantly lower rate of failure in the interim. The fallacy of the bathtub curve seems to derive from the fact that so many failures follow the infant mortality curve, which is indiscernible from a bathtub curve until or unless the item is allowed to run to failure to collect the additional age-related data.
One mitigating factor is the strong desire to avoid failure, which drives the oft misaligned premise that preventive maintenance is the correct method to accomplish this goal. There have been several studies, including the work of Nowlan and Heap, showing that increased preventive maintenance actually leads to increased number of failures, many of which fall into the self-perpetuating infant mortality pattern.
The U.S. Navy, when it performed its study in 1982, arrived at the same 3% of failures attributable to the bathtub curve but saw radically different values for wearout (increased to 17%), random (increased to 42%) and infant mortality (decreased to 29%), though still arriving at a similar aggregate value (88%).
Though the data was different, it proved the vast majority of the failures still fell somewhere on the bathtub curve, which were continually and incorrectly thought to follow this pattern.
In an age of ever-increasing caution, it becomes difficult for end-users to justify the cost and/or risk in performing an age exploration to seek to extend intervals beyond OEM recommendations. Only the most ardent reliability professionals seem to be able to pursue these programs, but hopefully others are inspired by this presentation of data, going back 50 years, that shows overcoming infant mortality is of far greater concern than the anticipated wearing out of a part.
 Evan Zabawski, CLS, is the senior technical advisor for TestOil in Calgary, Alberta, Canada. You can reach him at ezabawski@testoil.com
.