Used-oil analysis for predictive maintenance
Jean Van Rensselar, Contributing Editor | TLT Cover Story January 2012
An arsenal of techniques allows end-users to safely extend drain intervals—without jeopardizing equipment.
KEY CONCEPTS
•
Predictive maintenance is a proven, cost-effective tool for certain types of machinery.
•
Predictive maintenance is not the same as preventative maintenance.
•
Industries such as power generation are prime candidates for predictive maintenance.
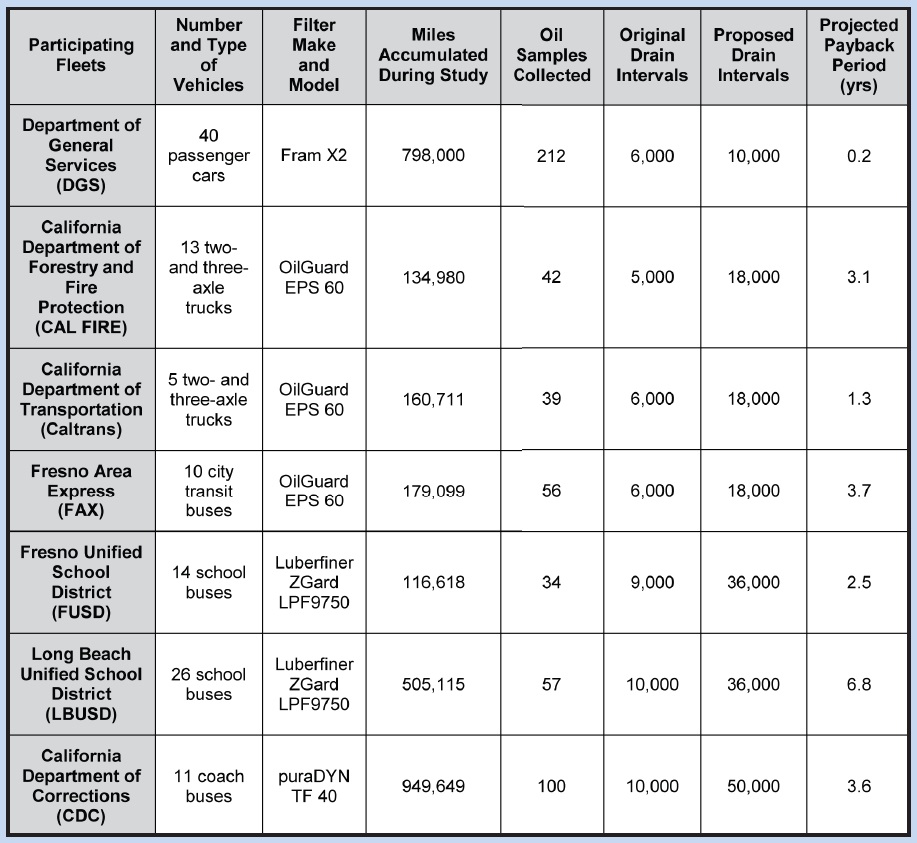
AMONG OTHER FINDINGS, a 2008 study conducted by the California Department of Toxic Substances Control (DTSC) concluded that end-users should follow manufacturers’ recommendations for oil change intervals and institute routine oil analysis programs to extend oil change intervals.
In fact, the fleet manager survey, a part of the study, confirmed that the average oil change interval is considerably shorter than the maximum suggested by oil condition-based analysis results. The conclusion reads in part as follows:
“The oil analyses showed that oil drain intervals can be extended for all vehicle types studied. Oil sampling results indicate that in many cases, oil drain intervals can be extended beyond the maximum level recommended by the vehicle manufacturer.
“For fleets that have already extended their oil drain intervals to the maximum recommended by the manufacturer, many can further extend oil change intervals by using better oil and by establishing oil analysis programs to determine the optimum drain interval. Routine oil analysis is an important tool that ensures good oil condition and provides safety for the engine.”
“In some cases, oil sampling alone can be used to extend drain intervals. A basic oil analysis program including physical and chemical parameters, like viscosity, TBN, oxidation, nitration and common oil contaminants, like water, dirt and wear metals, would be sufficient to ensure oil condition and satisfy fleet managers (
1).”
This comes as no surprise to the companies that have been relying on oil analysis programs for many years and have seen the benefits—mainly substantial cost savings and increased equipment reliability. But others still need convincing.
Aside from the real possibility of being able to extend drain intervals, oil analysis can be a powerful predictive maintenance tool that can:
•
Increase equipment reliability
•
Reduce unscheduled downtime
•
Reduce overall maintenance expense
•
Pinpoint abnormal conditions and wear trends
•
Streamline maintenance procedures
•
Optimize repair parts inventory
•
Document warranty claims
•
Improve repair scheduling
•
Identify human error and neglect
•
Extend equipment life.
Predictive maintenance determines the condition of in-service equipment in order to forecast maintenance. This leads to cost savings over other methods because maintenance intervals are usually extended. Corrective maintenance can be scheduled when it’s convenient without risking equipment failure.
The
predictive aspect of predictive maintenance results from forecasting future conditions using trend analysis. This approach relies on established statistical process-control principles to determine exactly when and what maintenance is necessary. Most predictive maintenance inspections are performed while equipment is running, minimizing operational disruption.
 No two pieces of equipment are alike and no two pieces of equipment operate in exactly the same conditions using the same horsepower.
www.canstockphoto.com
PREDICTIVE VERSUS PREVENTATIVE
No two pieces of equipment are alike and no two pieces of equipment operate in exactly the same conditions using the same horsepower.
www.canstockphoto.com
PREDICTIVE VERSUS PREVENTATIVE
Most people don’t know the difference between predictive and preventative maintenance—thinking they’re the same thing. Not so. Preventive maintenance occurs on a predetermined calendar or run-time schedule, while predictive maintenance is based on the actual condition of the equipment. The differences are significant, but the two types of maintenance have the following three goals in common:
1.
To maintain the production equipment and plant utility systems equipment in the best possible operation condition.
2.
To have all equipment ready to start up with as little unplanned downtime as possible.
3.
To complete all work on a regularly scheduled basis without exceeding the point of diminishing returns on investment for the labor, tools and materials required to perform the work (
2).
A simple analogy is an automobile. Owners have two choices when it comes to determining oil change intervals. They can either follow the manufacturer’s recommendations or those of the neighborhood oil-change facility. Most people opt for the former because the manufacturer has more credibility and oil change intervals are usually longer.
However, what if, instead of bringing the car into the dealer for an oil change, owners brought it in regularly to have the oil tested instead? After a few tests the dealer would be able to establish a trend for that particular car and tell the driver exactly when the oil needs changing.
This would have obvious advantages such as reducing the need for oil changes—less cost, less hassle for the driver. But in this case, the cost of paying for the oil analysis would offset paying for fewer oil changes. However when it comes to expensive and critical commercial equipment, it’s a different ballgame. For commercial equipment there are many other considerations—most notably the cost of shutting down equipment for routine preventative maintenance or the cost of shutting down an entire production line—in the event of equipment failure.
It takes about 30 minutes to change the oil in your car, but it can take hours to change the oil in a large piece of plant machinery. During that half hour, you’re reading a newspaper and sipping coffee. During those hours, one or more plant operations are down—very expensive.
PREDICTIVE MAINTENANCE BENEFITS
When comparing reactive, preventive and predictive maintenance, it’s not surprising that studies consistently show that, regardless of the industry, reactive maintenance is the least cost effective. In the electric power industry, detailed case studies and an associated 2006 “Plant Maintenance Cost Justification” study were generated in the U.S. by the Electric Power Research Institute (EPRI) and these show the following results (
3):
Comparative Maintenance Costs (Total Maintenance Expense/HP Used Per Year)
1.
Reactive: $17.
2.
Preventive: $13 (= 24% reduction from reactive maintenance).
3.
Predictive: $9 (= 47% reduction from reactive maintenance).
The EPRI studies show that, when compared with the reactive approach, an overall maintenance cost reduction of 47% is generally obtained by using predictive maintenance techniques.
In addition, Pat March, a senior mechanical engineer at the Tennessee Valley Authority (TVA) Engineering Laboratory, prepared the following summary based on the results of a multi-industry survey of firms that had used or were using predictive maintenance techniques (
4):
Benefits of Predictive Maintenance
•
Maintenance cost reduced 50% to 80%.
•
Machinery breakdowns reduced 50% to 60%.
•
Spare parts inventories reduced 20% to 30%.
•
Total machine downtime reduced 50% to 80%.
•
Overtime expenses reduced 20% to 50%.
•
Machine life increased 20% to 40%.
•
Overall productivity increased 20% to 30%.
•
Profit increased 25% to 60%.
From 1970-2003, U.S. aircraft carrier maintenance planners have used a machinery condition analysis program (that included oil analysis) to determine the specific condition of more than 400 pieces of rotating machinery on each carrier. This information has been used to make decisions on whether equipment should be repaired or overhauled and if maintenance could be safely deferred. In all, they conducted 5,659 machine tests at an average cost of $161 per machine.
The cost benefit ratio broke down as follows (
5):
•
Year: 1977 cost benefit 18.8/1
•
Year: 1988 cost benefit 19.0/1
•
Year: 2000 cost benefit 19.5/1
•
Year: 2001 cost benefit 20.0/1
•
Year: 2002 cost benefit 20.9/1
•
Year: 2003 cost benefit 23.0/1
This information made the maintenance and repair planning process more accurate and cost effective and reduced the incidence of failures and unscheduled repairs for these machines.
FOUR TYPES OF MAINTENANCE APPROACHES
According to STLE-member Evan Zabawski, senior reliability specialist for Fluid Life in Edmonton, Alberta, Canada, when it comes to equipment maintenance, there are four basic approaches.
1.
Reactive Maintenance. Example: Your tire goes flat (fails) and you fix the leak or replace the tire. Action based on reaction.
2.
Preventive Maintenance. Example: You replace a complete set of tires based on time or mileage only. Action based on schedule only.
3.
Predictive Maintenance. Example: You replace a tire or set of tires based on measuring tread depth. Action based on measurement.
4.
Proactive Maintenance. Example: You check your tire pressure routinely because you know from past failures that this action prolongs the life of the tire. You still check tread depth for signs of failure, and you are vigilant when the mileage approaches the equivalent mileage of your last set of tires. Action based on learning from past failures, i.e., never let it fail for the same reason twice.
TREND ANALYSIS VERSUS INDIVIDUAL REPORTS
No one would argue that it’s always best to analyze used-oil data based on regular samples taken over time. Trend analysis is the core component of predictive maintenance. It’s important to establish a baseline and a strategic interval to extract oil samples from the engine.
STLE-member Jason Papacek, data analysis manager for POLARIS Laboratories® in Indianapolis, explains, “The real value of oil analysis is not in reacting to individual reports but to trends that are identified through regular sampling. An individual report represents one moment in time. Trending documents the entire journey up to that point and provides much more information as to why or how you got there and can greatly affect how you react to the results.”
While specific limits are noted by all engine manufacturers, trending toward those limits may indicate that a problem is developing in the engine before the limit is reached. For example, upward movement of both viscosity and acid numbers over time is an indication of thermal degradation or oxidation. For every 18 degrees above 160 F, the oxidation rate of an oil doubles.
Analysis of wear metals is important to monitor the condition of the individual wearing components of a system. In engines you are looking at many components—pistons, rings, liners, bushings, bearings, camshafts, crankshafts, gear train, etc. An absolute limit in wear metals is not nearly as useful as the rate of wear or upward or downward trend of wear metals. This metals-trend monitoring identifies slowly progressing damage that would not be obvious in a single sample. Papacek posed the following examples:
Example 1. You suspect a problem and take a sample. The report shows particle count is unusually high. Your first instinct may be to change the oil to fix the problem. Had you been trending results over a period of time, a sudden jump in particle count wouldn’t necessarily be reason for panic. You would be more inclined to ask questions as to why there was such an abrupt change. Did someone new take the sample? Was it taken from a different sample point? Did the contamination occur after the sample was taken? Your reaction would be different and could prevent unnecessary maintenance action.
Example 2. You get an abnormal vibration reading and a sample is taken. The report shows elevated silicon (dirt) and iron (wear metal) levels, indicating that wear is occurring, likely due to dirt contamination. If the same unit was sampled regularly, dirt ingression could have been detected earlier and identified a deteriorating seal before a wear condition developed. Damage to the unit could have been minimized or prevented altogether.
“Trending is absolutely necessary for a successful condition-based maintenance program because you’re making maintenance decisions based on the health of the lubricant and the component,” Papacek says. “For example, let’s say the preventative maintenance on a compressor is every 1,000 hours. This could be too long to wait if a serious contamination issue arises and is not detected. It could be too early if the component is well-maintained and the oil is suitable for use beyond 1,000 hours.
“Oil analysis can pinpoint sudden changes and help you determine if an oil change should be made prior to the scheduled preventative maintenance or if it can safely be extended beyond it, saving additional lubricant costs and labor,” Papacek adds.
 A study by the electric power research institute revealed that predictive maintenance reduced total maintenance costs 47% compared to reactive maintenance.
EXTENDING DRAIN INTERVALS
A study by the electric power research institute revealed that predictive maintenance reduced total maintenance costs 47% compared to reactive maintenance.
EXTENDING DRAIN INTERVALS
Most original equipment manufacturers recommend or specify oil drain intervals and the type of oil. These recommendations are often specified in the warranty. And while they provide a good baseline for maintenance, these recommendations don’t take into account all operating conditions and applications.
For example, taking into account the operating length (in terms of miles and/or hours) on both the oil and the engine is key to determining the most accurate drain interval recommendation. The ability to compare these measurements with the test results allows the analyst to accurately and safely pinpoint an optimum drain interval. Also remember that no two pieces of equipment are alike and no two pieces of equipment operate in exactly the same conditions using the same horsepower.
There’s really only one way to know if the OEM’s drain intervals are optimal for a particular piece of equipment— regular independent oil analysis. End-users can feel confident that they are extending drain intervals safely if they take into consideration the OEM’s specifications, their own oil analysis results and independent laboratory recommendations.
Monitoring total base number (TBN) along with both oxidation/nitration and viscosity trends and tracking contamination and wear is the best way to optimize diesel engine drain intervals. The bottom line is that you should always consult with the OEM, the lubricant supplier and the laboratory analyst before exceeding the OEM’s specified drain interval.
“Lubricant consumption and labor costs can be greatly affected by extending drain intervals,” Papacek says. “For example, take a plant with four compressors that are scheduled for monthly oil changes. Sump capacity for each is 150 gallons. Changed monthly, this totals 7,200 gallons per year. Assuming compressor oil costs range $15-$25 a gallon, the annual lubricant cost will range from $108,000- $180,000. Oil analysis has the potential to reduce the number of oil changes to four times a year, reducing lubricant costs to between $36,000 and $60,000—an annual savings of $72,000 to $120,000.”
He continued, “Take this a step further and let’s say each oil change takes a technician an hour to an hour and a half. Twelve per year, per compressor, represents 48 to 72 hours in labor. Reducing the number of oil changes from 12 to 4 per year, per compressor, is 16 to 24 hours in labor—a savings of 32 to 48 hours in labor per year that maintenance personnel can use to focus on other issues.”
INDUSTRY APPLICATIONS
Why is predictive analysis more important in some industries than in others? There are a number of considerations:
•
The purchase and replacement cost of the equipment.
•
The machine’s degree of criticality— what happens if it goes down?
•
The physical difficulty of changing the oil.
•
The scale and cost of the oil and filters.
Two industries that deal with all four of these factors are the power generation (particularly wind turbine) industry and the aggregates industry.
Power generation. When it comes to power generation, there’s very little margin for error. With few exceptions such as medical devices, equipment doesn’t get much more critical than this. On Dec. 8, 1998, a massive power outage that affected more than 350,000 customers in the San Francisco area occurred when a utility worker tried to place a substation online while it was still grounded for maintenance (which likely included an oil change). This drew so much power from the transmission lines that 25 other substations in the area automatically and immediately shut down. Power was out from 8 a.m. to 4 p.m. Considering that the power outage spanned almost an entire workday in a major metropolitan area and that this happened in the era before widespread implementation of data disaster recovery, it’s surprising that total losses were estimated only in the tens of millions.
Then there are wind turbines. Think its fun to change the oil about 400 feet above a raging sea in an offshore turbine? If ever there was an industry that could benefit from safely extending oil change intervals, wind turbines—with extremely expensive equipment and highly difficult to access mechanical parts such as gearboxes and generators—is it.
Any company in any industry dealing with one or both of these issues should take notice of an exhaustive study and 2006 report cited by the World Wind Energy Association. After running through seven cost-benefit case studies, the report concludes the following: “The above case studies clearly show the direct economic benefits of using predictive maintenance strategies and highlight the special importance of using such strategies in the context of wind turbines, where their unique operational considerations create additional abnormal stresses and strains (
6).”
Aggregates. It’s not hard to imagine that the aggregates industry is heavily dependent on oil analysis and predictive maintenance. Much of the equipment involved is large, relatively expensive and critical to operations.
Keith Pittman, equipment manager for Aggregates USA in Macon, Ga., is responsible for 13 quarries. He says that while his company budgets for maintenance at regular industry-established intervals, regular oil sampling and the information it provides allows them to delay major rebuilds and significantly extend repairs.
“We’ve gradually been moving away from a preventive maintenance program toward a predictive maintenance program,” he explains. “Oil sampling analysis provides insight into what is going on with each component on the machine. It gives us the opportunity to make educated decisions on rebuild intervals. We currently budget repairs at 25% longer life than manufacturer-recommended intervals, and oil analysis allows us to push these out even further.”
He added that because of its aggressive oil analysis program, Aggregates USA has moved all oil-change intervals past 500 hours. Pittman believes the three most important requirements for a successful oil analysis program are:
1.
Education: educating the mechanics taking the samples.
2.
Trend analysis: taking enough samples to establish a trend.
3.
Follow-up: repairing the machine when analysis indicates a problem.
Pittman explains that Aggregates USA saves resources, time and money through its oil-sampling initiative. “Our environmental-compliance people like it for obvious reasons, operations likes it because of the increased equipment up-time we’ve experienced, mechanics like it because they can spend more time troubleshooting issues and less time servicing machinery, and the bean-counters like it because we spend less money on unneeded services.”
RECOMMENDED OIL DRAIN INTERVAL EXTENSIONS (7)
OIL DEGRADATION STANDARDS
Following are a few standard and newer tests, in addition to viscosity index and total acid number (TAN), that labs most often use. The specific tests and frequency vary from lab to lab and company to company.
Fourier Transform Infrared Analysis (FTIR). ASTM D7418 Infrared Spectroscopy (Fourier Transform Infrared Analysis or FTIR) is a method for measuring the chemistry of organic molecular components. FTIR monitors additive depletion, organic degradation byproducts and a host of possible contaminants. It can verify the level of oil degradation by the identification of the functional groups (e.g., ketones, carboxylic acids) in molecules. It is an excellent test to measure chemistry changes of the fluid basestock in addition to identifying what is responsible for the fluid degradation.
The new ASTM standard for FTIR is a significant improvement over E2412. There are also several other specific methods that have been created:
•
D7214-07a: Standard Test Method for Determination of the Oxidation of Used Lubricants by FTIR Using Peak Area Increase Calculation
•
D7412-09: Standard Test Method for Condition Monitoring of Phosphate Antiwear Additives in In-Service Petroleum and Hydrocarbon- Based Lubricants by Trend Analysis Using Fourier Transform Infrared (FTIR) Spectroscopy.
•
D7414-09: Standard Test Method for Condition Monitoring of Oxidation Antiwear Additives in In-Service Petroleum and Hydrocarbon- Based Lubricants by Trend Analysis Using Fourier Transform Infrared (FTIR) Spectroscopy.
•
D7415-09: Standard Test Method for Condition Monitoring of Sulfate Antiwear Additives in In-Service Petroleum and Hydrocarbon- Based Lubricants by Trend Analysis Using Fourier Transform Infrared (FTIR) Spectroscopy.
Ultracentrifuge Test. This test uses gravity to extract and settle any oil contaminants—basically it isolates all insolubles. The sediments are compared with established sedimentation rates in order to determine the oil degradation. In the lab, the sample spins at 20,000 rpm in a centrifuge for 30 minutes. The minimum value of 1 represents no to low-total insoluble levels. The maximum value of 8 represents a critical level of insolubles. One of the limitations is that the process also can remove additives such as VI improvers, dispersants and sulfonates.
Membrane Patch Colorimetry Test (MPC). This test, designed to pinpoint soft contaminants, identifies the varnish potential rating and is based on colorimetric analysis. A direct correlation is made from the color and intensity of the insolubles to oil degradation. This test is highly sensitive and reliable. The procedure is currently going through an ASTM round robin to determine the precision of the method in an effort to publish a standardized test procedure.
STLE-member Greg Livingstone, chief marketing officer for Fluitec International in Rutledge, Ga., explains that MPC is a combination of well-established patch testing methodologies that have been used for decades for fuel and lubricant contaminant analysis and research done by STLE Fellow Dr. Akira Sasaki on colorimetric testing. The method has been optimized for testing in-service turbine oils and assessing the fluid’s potential to develop deposits.
“Most other oil analysis tests will not detect the accumulation of degradation products in a fluid that may lead to sludge and varnish,” Sasaki says. “MPC is currently being used around the world to measure varnish potential in turbine oils and has proven to be indispensable as an early warning indicator of a fluid’s deposit tendencies.”
Gravimetric Analysis. This test determines the level of oil degradation by measuring the weight of residual components.
Rotating Pressure Vessel Oxidation Test (RPVOT) ASTM D2272. Oxidative stability is an important property of lubricating oil. The RPVOT test is a controlled, accelerated oxidation test that measures the performance of remaining antioxidant additives. Results are evaluated and compared to new oil levels.
Linear Sweep Voltammetry (LSV). ASTM D6971 LSV (also known as RULER) determines the oxidative health of a lubricant by measuring the primary antioxidants it contains. LSV is a patented process of identifying the type and relative concentration of primary antioxidants in lubricants and greases. It’s currently in five ASTM procedures and provides deeper insight into the health and remaining useful life of the fluid. Alternative methods of measuring primary antioxidants rely on indirect measurements, such as determining the oxidative stability of the fluid through stress tests like RPVOT. Although there is value in performing oxidative stress tests in many situations, LSV has proven advantageous in monitoring in-service fluids used in oxidative environments because of the test’s higher precision and faster results.
Livingstone explains, “MPC and LSV tests are complimentary in nature and are often coupled together when performing analysis on in-service turbine oils. LSV is also applicable in a wide range of other lubricants used in oxidative environments ranging from diesel engine oils and helicopter jet turbines to specialized synthetic fluids used in offshore wind power.”
 Trend analysis is the core component of predictive maintenance.
www.canstockphoto.com
EDUCATING USERS
According to STLE-member Cary Forgeron, national sales manager for Analysts, Inc., in Hawthorne, Calif., there are three common user pitfalls regarding predictive maintenance programs.
1. Thinking that one technology is enough. “A common misconception many inexperienced practitioners have is that one technology can tell them everything,” Forgeron says. “There are limits to every technology. Utilizing a single technology leaves the practitioners vulnerable to potential problems that are not detectable by that technology. For example, oil analysis cannot identify a misaligned bearing until sufficient damage has occurred. Not knowing what tool to utilize in your predictive toolbox can leave you blind.”
2. Doing too much too soon. “A predictive maintenance program requires a lot of planning and education before it can get off the ground,” Forgeron says. “I have been to many facilities to help review their oil analysis programs. The first question I always ask is, ‘Why are you doing oil analyses. While the responses vary, a common answer is, ‘I don’t know.’”
Forgeron says that not knowing what you want to accomplish makes it hard to determine what you should be doing. He adds that starting with a clear and measureable objective (i.e., reducing the number of bearing failures) is the best way to begin. From there users can choose the predictive tool most applicable to accomplishing those goals. He suggests starting small with 5-10 critical pieces of equipment and expanding from there.
3. Not understanding the sampling process. “The biggest drawback I see for an inexperienced practitioner, as it relates to my field of oil analysis, is understanding the sampling process,” Forgeron says. “Oil analysis is a science, and the tests are only as accurate as the sample they are performed on.” Improper oil sampling can lead to a false positive, which results in shutting down equipment unnecessarily. Even worse, it can lead to a false negative, which can lead to an unidentified equipment failure. The person taking the sample is just as important as the person interpreting the results, but insufficient training often leads to the sample taker being the weakest link in the predictive maintenance chain.
The objective of oil analysis is to provide early detection of incipient lubricant degradation, identify contaminant ingression and monitoring machine health by trending the addition of wear metals.
“Lubricant analysis can be considered in two ways: from a mechanical perspective and a chemical perspective,” Livingstone says. “Seldom do we see someone have a strong aptitude in both fields. The first sign of fluid degradation is detectable by chemistry changes in the lubricant, making oil analysis such a strong predictive tool for reliability engineers. Eventually, as the fluid degrades it impacts the mechanical functioning of the equipment. At this point however, the plant is forced to take much more resource-intensive, reactive maintenance actions.”
He adds, “In order for oil analysis to be an adequate predictive tool, the correct tests must be done at appropriate intervals. Although this sounds obvious, far too often we see valueless tests being done at inappropriate intervals in order for the program to provide significant predictive value. The biggest challenge that we have as oil analysis practitioners, however, is translating laboratory results into real-world knowledge that allow plant operators to assess the risk of taking action versus not taking action. Ultimately, this requires the marriage of chemical and mechanical knowledge. However, plants that bridge these two disciplines gain tremendous value and competitive advantage by using oil analysis to increase the profitability of their operations.”
If performed correctly by an experienced lab and experienced technicians, predictive maintenance is one of the most cost-effective equipment maintenance procedures around for many types of equipment. The key to a successful program that consistently yields a significant return on investment is choosing the right equipment and the right lab.
REFERENCES
1.
“Evaluation of High Efficiency Oil Filters in the State Fleet.” In the study, researchers were able to use oil analysis to quantify the drain extension allowed by HE filters. The study is located
here.
2.
Preventive & Predictive Maintenance, by Ken Staller. Full text available at:
here.
3.
Information from
The Benefits of a Pro-Active Approach using Preventive and Predictive Maintenance Tools and Strategies – Actual Examples and Case Studies, 2006: click
here.
4.
Ibid
5.
Ibid
6.
Information from
here.
7.
“Evaluation of High Efficiency Oil Filters in the State Fleet.” In the study, researchers were able to use oil analysis to quantify the drain extension allowed by HE filters. The study is located
here.
 Jean Van Rensselar heads her own communication firm, Smart PR Communications, in Naperville, Ill. You can reach her at jean@smartprcommunications.com
.