Identifying varnish and oxidation precursors in lubricant sumps
Mike Johnson & Greg Livingstone | TLT Best Practices April 2011
Keep fluids in a clean environment to prevent varnish and preserve your machine’s lifecycle.
www.canstockphoto.com
KEY CONCEPTS
•
Varnish in lubricant and circulation systems can harm your machines and reduce productivity in a variety of ways.
•
Controlling varnish formation starts with maintaining contaminants and sump conditions.
•
The risk and presence of varnish can be measured either directly or indirectly.
One of the primary failure modes for lubricants and hydraulic fluids serving in thermo-oxidative (high-temperature, high-degradation) environments is the production of deposits commonly referred to as varnish. The impact that varnish deposits have on the lubrication system is application specific and, in most cases, can be harmful to your machines and reduce productivity.
In the case of hydraulic plastic-injection molding machines, varnish can cause erratic valve movements that lead to scrap rate increases and yield decreases. In a paper machine, deposits such as those seen in Figure 1 can compromise the precision of the press-roll control, impacting paper finish and quality which then impacts the paper’s market value.
 Figure 1. Deposits in a sensitive paper machine can impact the quality of the finished paper product.
The highest-profile varnish problems, however, are found in large-frame gas turbines used in the power generation industry. Even a small amount of varnish may impact the availability and reliability of a power plant, and the cost of a varnish-induced event is very high. If a peaking turbine is not able to start due to a sticky servo value when the grid demands power (often called a fail-to-start condition), the plant incurs significant costs. If the turbine is firing at full load and is tripped due to an alarm caused by a sticking valve, the costs can easily exceed $100,000.
Varnish can even negatively impact the many low-criticality support systems that represent 80% of a plant site’s machine complement. For instance, a thin layer of varnish on plain and element bearings, as shown in Figure 2, can act as an insulator, preventing the lubricant from adequately cooling the bearing surface, which can trigger alarms. Varnish deposits on gears and element bearings attract dirt and debris like flypaper, increasing the rate of abrasive and fatigue wear to the gear teeth, races and elements. In some lubricant systems, varnish first develops in the reservoir. If it doesn’t spread to other critically lubricated components within the system, it poses little reliability risk to the machine but can increase the rate of degradation of the oil each time the sump is changed.
 Figure 2. Deposits on tilt bearing pads in a steam turbine.
For these and many other reasons, it is particularly important for the reliability engineer to be aware of the risk and have a method in place to accurately measure the presence of the precursors to oxidation byproducts that lead to formation of both soluble and insoluble contaminants, which can produce visible varnish and other oxidation byproducts. This article is Part II of this five-part series and examines what varnish is, what causes it and how to measure the precursors of the condition.
VARNISH CONTAMINATION
Varnish is typically defined as a thin deposit in a lubrication system that is difficult to remove and Comprised primarily of organic residue. It is created by chemical reactions within the lubricant that fall under the general heading of oxidation. Lubricants that are formulated for use in thermally stressful environments contain additives called antioxidants whose purpose is to slow down chemical reactions that produce the organic residue.
These antioxidant molecules are more reactive species than the base oil and, therefore, sacrificially degrade in an effort to protect the base oil. It is not surprising when doing chemical analysis of varnish deposits in a system to find that their main composition is degraded antioxidants, which have reacted with base oil components. Antioxidants are divided into primary and secondary classes.
Primary antioxidants such as amines and phenols will, upon depletion, form organic byproducts whose solubility depends upon temperature and pressure. The temperature at which these contaminants dissolve in oil is usually between 40 C and 55 C. there may be a wide range of contaminant chemistries present in one oil system, depending upon the temperature and mode of degradation. Each degradation product may have different solubility characteristics and may precipitate out of the fluid at different rates.
The fluid in Figures 3 and 4 contains an example of a varnish product that is insoluble at low temperature (
see Figure 3), but becomes part of solution at a moderate temperature (
see Figure 4). In most cases, the degradation products come out of solution at room temperature over 72 to 96 hours. However, it may take a week or more for the contaminants to precipitate out. Clearly, testing for these organic varnish precursors is more challenging than their inorganic cousins.
 Figure 3. At room temperature, this degraded oil is cloudy due to a high amount of soft contaminants. (Courtesy of Ansaldo Thomassen, The Netherlands)
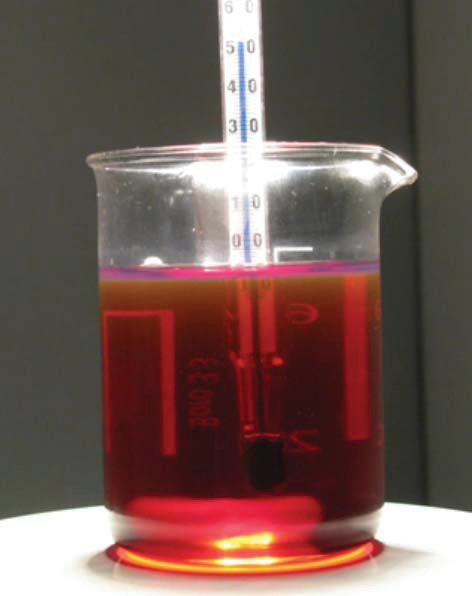
Figure 4. At 50 C, the oil instantly becomes clear and bright as the degradation products solubilize. (Courtesy of Ansaldo Thomassen, The Netherlands)
Many hydraulic formulations utilize secondary antioxidants such as zinc dialkyl dithiophosphate (ZnDDP). Upon depletion, ZnDDP forms sulfates and phosphates, which are often insoluble in the oil. In many respects, insoluble degradation products are easier to measure as these products do not transition in and out of solution.
CAUSES
In short review, there are various stresses in a lubricating system that causes the fluid to break down. Oxidation is the primary reason for lubricant failure in most systems. Oxidation’s destructive rate on the lubricant is accelerated by temperature and various metallic components and gaseous catalysts. Depending upon the environment of the system, several other degradation regimes may be present such as:
•
UV radiation
•
Radiological contamination
•
Reactions with incompatible chemistries
a.
Water may cause hydrolysis
b.
Wear metals accelerate reactions
c.
Additive or Base oil incompatibilities
d.
Compressor gases.
There are also thermal events that can occur in the oil and cause the fluid to break down, resulting in varnish creation. Electrostatic spark discharge is a phenomenon whereby static electricity is accumulated as rapidly flowing, nonconductive lubricants are passed through very small spaces until the energy is released in the form of a spark. This mode of degradation has been shown to be a primary cause of fluid degradation in some systems.
Additionally, hot spots in the system also can cause coking and thermally attack the hydrocarbon backbone of the lubricant. Micro-dieseling is also a common cause of thermal degradation in hydraulic and some lubricating systems. The implosion of air bubbles as they migrate from low-pressure zones to high-pressure zones creates carbonaceous byproducts. As system pressures increase, the potential for micro-dieseling also increases.
SOFT CONTAMINANTS
Performing oil analysis tests to determine the presence of varnish in a system is challenging for a few reasons. The sample of oil that is obtained for analysis may not be indicative of the condition of the lubricating system. If the lubricant in a heavily varnished system is changed without performing a flush to remove the deposits, the new oil may initially indicate a low varnish potential, even though there are deposits throughout the system.
Often in peaking or cycling gas turbines, the varnish potential will increase during times of the year of high demand and decrease when the unit is offline for several weeks. This is due to the degradation products coming out of solution in the oil and forming deposits throughout the lubricant system.
The lubricant degradation products (soft contaminants) responsible for causing varnish deposits can be challenging to measure. They are very small and often estimated at less than 0.1 μm in size, although they can easily agglomerate together. Soft contaminants are soluble and easily transition in and out of solution, depending upon temperature and pressure. suspension, so sample handling prior to testing impacts results. While the soft contaminants are in solution, they don’t typically impact the bulk chemistry of the fluid. This makes soft contaminants difficult to measure.
Most routine analytical tests are not successful in measuring the onset of varnish or the varnish potential of a lubricant. Fortunately, there have been several testing advancements in recent years that provide much more effective identification of underlying issues.
The first step in determining the potential to produce varnish is to understand its overall health and remaining vitality. This is influenced by a variety of things, as mentioned above, but the fluid’s antioxidant system health and strength (concentration) is paramount. The best way of determining the antioxidant’s remaining health, and consequently the fluid’s remaining useful life, can be done both directly and indirectly.
Direct methods are preferable, as the test results are not influenced by other components in the fluid. A technique called Linear Sweep Voltammetry (aka RULER) measurement identifies the antioxidant type and measures the quantity of additive present. The results are typically reported as a percentage of new oil and separated by antioxidant family.
An example can be seen in Table 1. This example indicates that the used oil contains 23% phenols and 56% amines (red line) of the original sample (blue line). Another effective method for measuring a fluid’s antioxidants is Fourier transform infrared (FTIR) analysis. This method is excellent at monitoring phenolic chemistries, though the amines are often masked by other additive components in the formulation, making them more challenging to detect.
Table 1. Example of analytical results from the RULER, which indicate the antioxidant health of the lubricant.

Indirect antioxidant measurement is measuring the effect of the health and concentration of the antioxidants in the subject fluid vs. the same fluid in its original state. There are a few accelerated oxidation tests that are commonly used to indirectly measure antioxidants such as rotating Pressure Vessel oxidation test (RPVOT) and Pressurized differential scanning Calorimetry (PDSC). Because these tests are influenced by other lubricant components, their results may not directly relate to the health of the antioxidant system. For example, copper passivators can neutralize the catalytic effect of the copper coil used in RPVOT testing, increasing the time it takes for the fluid to fail. The stability of the original basestock also provides influence.
There are other physical and chemical property measurements that may be useful in assessing the overall health of the fluid such as the fluid’s ability to handle contamination. In addition, how a fluid reacts with air or water also indicates something about the health of the fluid. When additive health is lost and/or the fluid has been cross-contaminated with incompatible chemistries (from other lubricants, water treatment chemicals or process chemicals), one of the first performance criteria that fails is demulsibility (ASTM D1401). Foam (ASTM D892) and air release (ASTM D3427) characteristics also change for similar reasons.
When compared to performance of the new fluid, each of these characteristics can indicate that some type of damaging change has occurred in the fluid. Since chemical incompatibility can be a cause of degradation products and varnish, these are important characteristics to know about the lubricant.
Profiling the amount of contamination in the fluid by particle counting, water and spectrographic analysis is also of value. However, one common measure, TAN (Total Acid Number), which has been a widely used fluid degradation test for decades, provides less value in many fluids today since degradation products may occur long before a change in TAN.
Once the overall health of the fluid is determined, measuring the amount of soft contaminants is the next step in determining a fluid’s propensity to produce deposits. The membrane Patch Colorimetry test, as shown in Figure 5, is the most widely used test for this purpose. The MPC method is quite simple as 50 milliliters of oil are mixed with 50 milliliters of solvent (usually petroleum ether) and filtered through a 0.45 mm nitrocellulose patch. The color of the patch is determined by spectrophotometer, and the results are reported in CIE LAB DE value, representing the total amount of color on the patch. In general, the darker the color stain on the patch, the higher the fluid’s varnish potential.
 Figure 5. Portable Kit for Membrane Patch Analysis.
This technique requires that the sample remain idle for up to a week at room temperature, prior to analyzing to ensure the soft contaminants have come out of solution. There is good correlation between the readings and actual field varnish issues, but interpretation is sometimes challenging.
Different degradation products may generate different color bodies. In rare cases, a fluid’s degradation products may be white, which renders the MPC test incapable of adequately predicting the fluid’s varnish potential. Conversely, sometimes there are very low or virtually no deposits in the oil, and the patch still produces a stain.
Any time one is taking measurements for the purpose of machine health diagnosis, it is advisable to have additional corroborating test data. In this instance, the gravimetric patch augments the MPC test effectively. Most importantly, one needs to understand what the analytical test is measuring and how those results may or may not relate to the specific application in question.
SUMMARY
Varnish is commonly considered to be a thin deposit in a system composed of organic material from the decomposition of the lubricant. It can also be of a soluble variety, which is difficult to identify and remove. As such, maintaining fluid in a clean, dry and cool environment and without chemical contamination is key to avoiding varnish and preserving machine and fluid lifecycles. Fluid analysis to identify the presence of either varnish or the precursor conditions that lead to varnish can be done both directly and indirectly. Varnish presence may be directly measured through photometric techniques such as the membrane Patch Colorimetry, which is useful for this purpose.
The precursors of varnish complications are conducted by measuring for fluid heath properties for antioxidant presence both directly and indirectly. These techniques each have strengths but should be corroborated with other methods where possible.
 Mike Johnson, CLS, CMRP, MLT II, MLA III, is the principal consultant for Advanced Machine Reliability Resources, in Franklin, Tenn. You can reach him at mike.johnson@precisionlubrication.com
.
 Greg Livingstone, CLS, is executive vice president—marketing and technology for Fluitec International in Tucson, Ariz. You can reach him at g.livingstone@fluitec.com
.